General Framework

Overview
The General Framework that the Daasity Agency leverages to help brands grow revenue and improve business performance is built on the five (5) pillars for building a data-driven organization. While there are five (5) pillars encompassing (i) insights, (ii) infrastructure, (iii) resources, (iv) governance and (v) culture, the Daasity Platform should address the majority of the infrastructure needs, leaving a brand to focus on the other four pillars. The Daasity Agency can support a brand by consulting on the insights available, providing strategic recommendations for how to grow revenue, and by educating internal teams on analytics best practices.
Insights enable organizations to see beyond numbers, translating data into actionable intelligence. This framework aims to both deliver insight into why (diagnose) the given business performance is occurring, and what (prescribe) to action can be taken to improve business outcomes.
Governance involves establishing processes, policies and standards for data usage and can only be effective when it goes hand-in-hand with strategic planning to align data initiatives and insights with business objectives.
Ensuring you have a team in place to own and deliver on the Insights and Governance pillars greatly increases the likelihood of recognizing value from the investment made into the Analytics Infrastructure. Having at least one internal stakeholder responsible for Insights and Governance outcomes is a key element of building a data-driven organization.
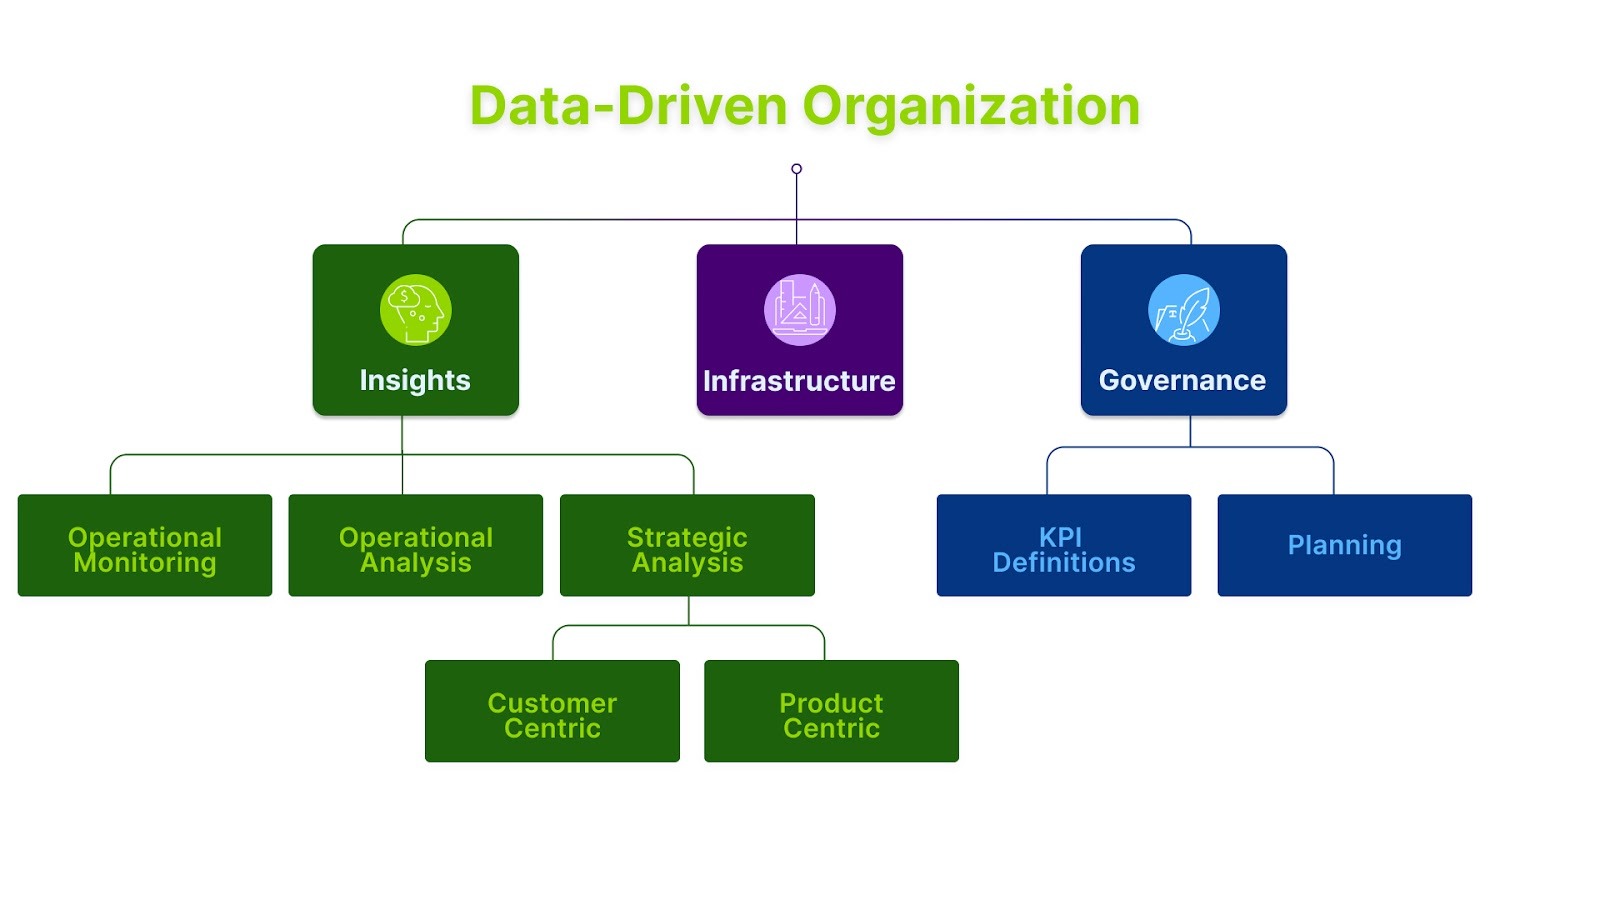
Governance
Ensuring we have proper Governance in place will make development of the infrastructure and implementation of proper insights much easier.
Governance is comprised of two sections: KPI definitions and Planning. KPI definitions are necessary for aligning a brand's reporting around metrics and data sources and Planning is necessary to build targets to track business performance against.
KPI Definitions
The goal of implementing definitions for KPIs, or any metric that is measured with data, is to align the organization around the definition and provide clarity on the source of that metric and how it should be calculated or measured.
Several signs that indicate a lack of governance around KPI definitions:
- We spend too much time arguing about what the actual number is for the same metric when several different teams provide reporting and the numbers don’t match
- We don’t know what the data source should be for a certain metric and everyone pulls it differently
This creates risk for an organization in making the wrong decision and thus we can clearly state the goal for KPI definitions as: I need to have a clearly defined and agreed upon set of definitions for business metrics so that we can become faster at decision making.
Planning
The goal of implementing a proper planning process is to ensure that we have the ability to track our performance with an understanding of if we are on-track to meet our strategic goals or if we need to alter course to achieve our goals. This starts with setting our strategic goals (ex: 5-year roadmap) but needs to drill-down to metrics at a monthly level that individual teams can own in order to track performance and have the ability to action on at the individual department level.
Several signs that indicate a lack of proper planning:
- We cannot identify our assumptions and how our assumptions are performing to plan
- We cannot measure our progress towards our goals using KPIs
- We cannot make resource allocation decisions to hit the targets that have been set
This creates risk for an organization as not being able to address gaps in the business and address performance issues which will result in the business missing their long-term business targets. Thus I need to be able to build a plan so that I can measure performance against the assumptions in my plan.
A good planning process should incorporate at least three (3) of the five (5) plans outlined below to help us set appropriate targets with a strong conviction that the targets are achievable as well as be able to track our assumptions so that we can hit these targets. The five (5) plans are:
- Tops Down Customer: this is a forecast that can provide an estimate of how our business should be able to perform based on customer behavior. For simplicity we use yearly or quarterly cohorts to estimate future performance and thus the model is not every efficient at generating monthly targets but is perfect for understanding high-level requirements like customer growth or retention performance improvement. This makes the tops down customer model perfect for setting annual targets that are part of a strategic plan.
- Bottoms Up Marketing Channel: this is a forecast that is often developed for the next 12 months at a monthly marketing channel level that allows us to set targets for sales performance across each marketing channel. The KPI targets that we develop as part of this model allow us to set targets that we can track and more importantly work to address within each channel if we start to underperform. This is one of the most critical forecasts to develop as it enables us to operationally monitor our business.
- Bottoms Up Customer Retention: this is a forecast that is often developed for the next 12 months, and within the Daasity platform, is automatically generated for the current month. This model is not required to build but is great for retention marketing teams as it helps set targets on how each customer segment should perform and can provide insight into underlying issues with your customers.
- Bottoms Up Product Channel: this is a forecast that is often developed for the next 12 months by merchandising / supply chain teams that indicates how our products should sell across each month by sales channel.
- Bottoms Up New Product: this is a forecast that can help us identify how much inventory to buy when introducing new products. The time horizon will be dependent on how long we plan to sell the product for (ie: evergreen or limited run).
The Bottoms Up Product Channel along with the Bottoms Up Marketing Channel becomes the two key forecasts needed to ensure that we have enough product for our channels to meet the targets of our Tops Down Customer forecast which should be used to develop our 5-year plan.
Insights
Insights, the ability to understand past performance and analyze our business to make informed strategic decisions, is broken into three (3) sections that enable our business to both track our performance to the plan we have created but also to inform what our strategic objectives should be. These sections are Operational Monitoring, Strategic Analysis, and Operational Analysis.
Operational Monitoring
Operational Monitoring has two (2) goals, first to help us identify if there is something critically wrong with our business so we can address the issue before it has a significant impact on our business, and second to track our performance to plan to help us identify the levers we need to use to get back on track. In summary, I need to be able to identify if something is broken in my business and what is driving the under or over performance so that I can take immediate action.
For a Digital business, or the digital portion of a business, we should be checking our operational KPIs on at least a weekly basis for performance but ideally on a daily basis to make sure our operations are running smoothly. For a Retail business, or the retail portion of a business, we should be monitoring at least on a monthly basis but more often on at least a weekly basis.
Several signs that we don’t have proper operational monitoring in place:
- Not having a clear analysis path to identify the source of under or over performance
- Don't have a plan to help me understand what I should expect for performance in more detail than just revenue
- Don't have a single place to be able to see all the operational KPIs together to help me identify the issue
Strategic Analysis
At the other end of the insights spectrum is strategic analysis which is a key input and often part of the planning process. Strategic Analysis should be done at least annually but is recommended quarterly.
Strategic analysis can be done via a customer-centric or product-centric approach.
A customer-centric approach helps us identify how to grow revenue by examining our retail and digital businesses, identifying the best levers to pull across acquisition and retention marketing strategies on the digital side and new or existing distribution strategies on the retail side.
Similar to our planning process, a product-centric approach will help us identify gaps and opportunities in our product portfolio that can improve the sales per customer we can generate and thus grow our revenue.
Several signs that we don’t have good strategic analysis in place:
- Don't know what the levers are to grow our revenue
- Don't know how to analyze performance and identify which levers provide the biggest opportunity
- Don't have a single place to tie all the data together to analyze all the levers together
Operational Analysis
Operational Analysis is the link between our strategic analysis and operational monitoring. As part of our strategic analysis we can identify new opportunities we want to grow our business and develop tests to execute on these new opportunities. Operational analysis uses many of the same KPIs as operational monitoring to track the key levers that drive performance and thus provide insight into how our strategies to grow revenue are performing. Essentially, I need to measure the operational impact of the changes that I have made to my business strategy so I can decide if we need to keep or change the strategy.
Several signs that we don’t have a good operational analysis framework in place:
- Difficult to understand if the operational change I'm making in my business has a positive or negative impact on performance - knowing a good way to analyze data (analysis path) for evaluating the impact of my strategy change
- Difficult to measure / know how to measure the change in strategy from operational data (what are the leading indicators)
- Don't have a single place to be able to tie all the data sources together I need to perform my analysis
The Framework Journey
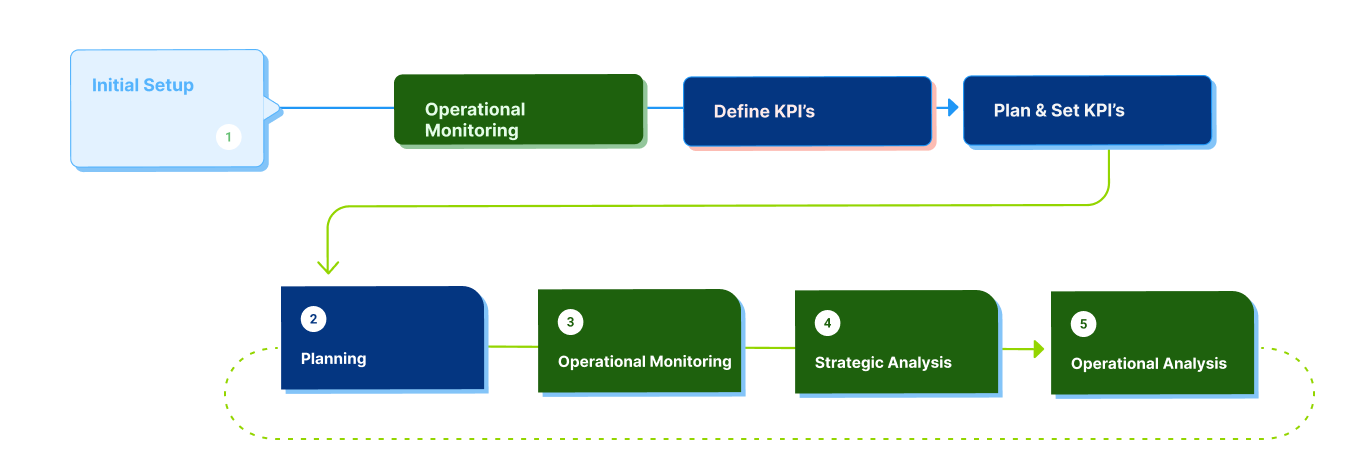
Using the framework is a journey that all brands will navigate in order to become data-driven and use their data to help drive their business.
The framework has an initial implementation phase which then transitions to a virtuous cycle that enables your brand to grow their revenue.
Initial Implementation
Initial implementation consists of three sections of the framework that should be executed in a fairly simultaneous manner to maximize the effectiveness of the virtuous cycle. We focus on Operational Monitoring , Planning and KPI Definitions.
Operational Monitoring (OM) is critical to start immediately as even though we may not be able to monitor our performance to plan, we can at least monitor our performance to recent trends and determine if there have been significant changes to our business that need to be examined. While monitoring our performance to plan is optimal, monitoring our trends is a much better alternative than not monitoring at all.
Creating and aligning on the sources and definitions for our KPIs is also a critical first step in our journey. This ensures that we, as an organization, agree on both the KPIs we use in our Operational Monitoring, Operational Analysis, Strategic Analysis and Planning and how we calculate them. Without alignment on KPI definitions we can easily fall into the trap of different teams reporting different numbers for the same metric and wasting time and resources trying to uncover why the variance exists. This is almost always a result of two teams sourcing the number from different platforms.
Planning is the final part of the initial implementation and also a critical component as this allows us to set targets for our Operational Monitoring. While it might be easy to track trends, planning allows us to determine our revenue targets but also targets for other KPIs that drive revenue and thus will give us much more insight into understanding and identifying the source for our variance to plan.
Virtuous Cycle
Once the initial implementation of the framework is complete we enter a virtuous cycle that provides us with the opportunity to improve our business performance by following a defined path through all the components of the framework. The virtuous cycle follows a Planning -> Operational Monitoring -> Strategic Analysis -> Operational Analysis back to Planning path. This path allows us to take learnings from tactical changes we make to the business and incorporate them into our plans. This determines if the adjustments have made improvements to our KPIs. We can easily monitor performance via Operational Monitoring and then follow the steps in the Strategic Analysis to determine where we should focus to maximize our revenue growth. Once we have identified the key levers we want to pull we then implement these new tactics and address via our Operational Analysis. If the changes in our tactics and strategy have positively improved our performance then we need to adjust our plans to reflect this new baseline performance and incorporate this new plan back into our Operational Monitoring.
Thus we have created a virtuous cycle where we build our plan, determine what is driving performance, implement new strategies and tactics and refresh our plan. All helping us drive revenue growth.
Tree Concept
Each of the different analyses paths are built on the concept of a decision tree. We use decision trees as they provide an easy way to understand and explain the decision-making process to the action or analysis that needs to be executed.
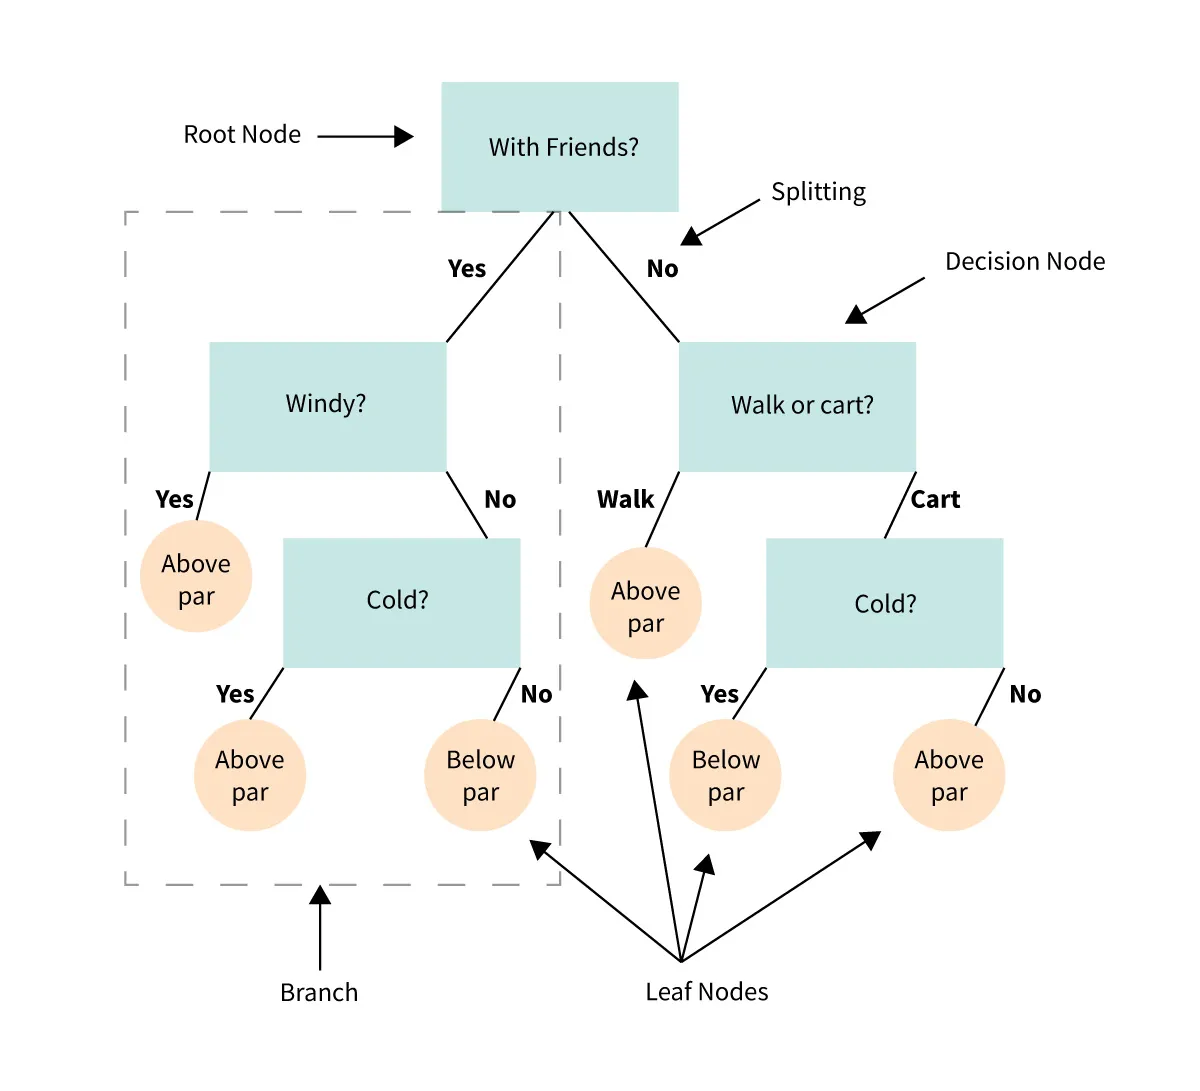
Decision trees have a hierarchical structure with tree-like structure starting with a root node, internal nodes that represent questions and leaf nodes that represent the action we must take.
- Root Node: represents the initial condition that we are trying to answer, ex: why is revenue up or down
- Internal Node: represents a question we need to answer based on looking at a specific metric
- Branches: based on the outcome of the question from an internal node, the branch we follow to the next node
- Leaf Node: the final outcome and action or analysis we must track to answer the initial question from the Root Node
With the decision tree, we will start at the top and work our way through the internal nodes, down the branches until we reach a single leaf node and have an action that we must follow.
KPIs and Definitions
Organizationally we must align on definitions and sources for our KPIs to minimize discrepancies that often arise when using different data sources for reporting and analytics. We outline the following as standard definitions for the metrics that Daasity believes should be tracked across digital, marketplace and retail sales channels
Authors

Dan LeBlanc

