Digital Operational Analysis

Data-Driven Playbook: Digital Operational Monitoring
Overview
The Digital Operational Monitoring framework provides a structure for any brand that sells online via their own website or via a digital marketplace (ex: Amazon, Walmart Plus) to understand why sales may have increased or decreased.
The goal is not necessarily to understand if a specific test or strategy is working but instead to monitor all of our system to understand if our performance has deviated significantly from our plan and thus we need to investigate to determine if a potential problem exists in our business. We should do this daily and move on with our day if everything is within range. If something is out of range then we need to investigate to ensure that something isn’t broken.
How do we understand the desired range? By creating a plan. The framework is best utilized when we leverage the Planning framework to develop a bottoms up forecast at the daily or monthly level as this allows us not only to compare KPIs across time but also against our plan.
The framework is built by breaking sales into components that we can both track as Key Performance Indicators (KPIs) and that our teams can directly control and thus change our overall sales.
We start with:
Sales = Orders AOV (Average Order Value)
Orders and AOV are not really levers that we can pull and so we want to break this down into further components. Let’s take orders…
Orders = Traffic Conversion Rate
It is much more reasonable to ask our marketing team to increase traffic and improve conversion rate than it is to increase orders. Why? Because we can control traffic by potentially spending more on Paid channels or sending more emails and we can make changes to our website to improve the conversion rate. These are direct levers that we can control.
Similarly we break AOV into component:
Average Order Value = Average Unit Revenue (Price) Units per Transaction (UPT)
Thus we can break down Sales into the following
Sales = Traffic Conversion Rate AUR UPT
And depending on the marketing channel can determine traffic either by
Traffic (Paid) = Spend $/Impression Clickthrough Rate (CTR)
Which is very easy to measure for platforms like Meta, Tiktok, Google Ads, etc. or for non-paid marketing that might be based on organic social, email, SMS, etc.
Traffic (NonPaid) = Activity Engagement / Activity Clickthrough Rate (CTR)
Thus we have a set of levers that we can track to evaluate the source of our over or underperformance.
This creates both diagnostic insights as it allows us to understand why something performed the way it did, via the KPIs, and creates prescriptive insights as it can tell us which lever we need to pull in order to address the gap. Additionally we can determine the extent to which we need to move the lever in order to get back to our target performance.
With the KPIs set that we want to track:
- Sales
- Orders
- AOV
And the levers that these KPIs break into:
- Marketing Spend (paid channels)
- Marketing Activity (non-paid channels)
- $ / Impression
- Engagement / Activity
- Click-through Rate
- Conversion Rate
- Average Unit Revenue (AUR)
- Units per Transaction (UPT)
This creates an analysis path for monitoring the performance of our digital business and creates what we call our Digital Operational Monitoring Framework.
Framework Concept
Our Digital Operational Monitoring Framework is built on the concept of a decision tree where you will start at the top and work your way through each node until you reach an endpoint where the potential issues that are causing the deviation from the plan are identified.
We start at the root node which is the simple question of has revenue significantly deviated from our plan? We can answer this with a simple yes / no and determine if that revenue deviation is from our own .com or from a marketplace (Amazon). The answer to this question will then lead us to a decision node where we are asked a subsequent question. By answering the additional question(s), we will eventually hit a leaf node where we have answered enough questions to help us identify the reason our revenue has deviated from plan.
With the reason(s) provided for the variance to plan we can then determine what, if any, action we need to take to address the variance and get back on track.
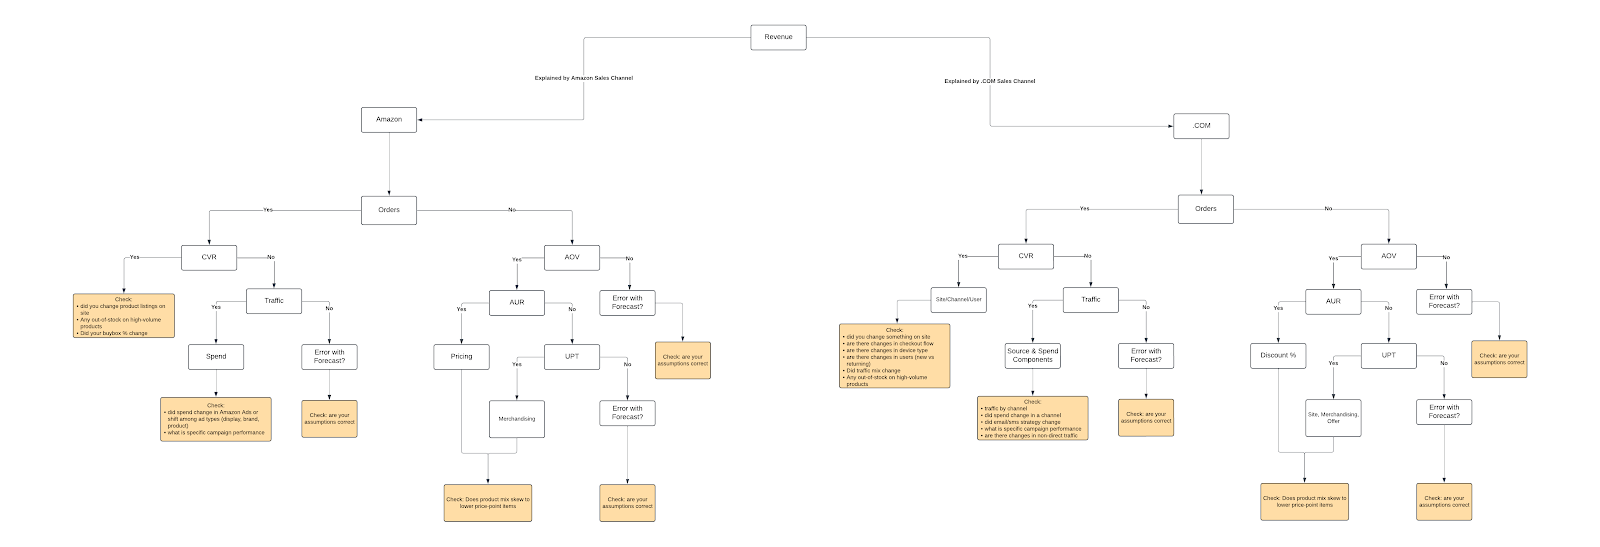
LucidChart of Digital Monitoring Analytics
Digital Operational Monitoring Path
In an ideal situation we have created a forecast or plan for our KPIs at the daily or monthly level and added these to our Forecast Brand Supplied Data (BSD) within the Daasity platform that will automatically allow us to compare our actual performance to our planned performance or we have developed a way that allows us to easily track all of these metrics in a single report.
Our KPI dashboard should be the first check of the day to make sure that nothing is broken - i.e. an unintended change has occurred and is negatively impacting our business. If our KPIs are within range we move on. The KPIs can be compared to the plan for today or compared to the recent trend (we recommend either comparing to the last 30 days as a line graph or to last week and last year as single points in time).
Channel
Our first question (root node) is to understand if our revenue has significantly deviated from our plan, or trend if there is no plan, and what channel is driving that variance. A significant variation can be defined by either a $ or % amount but should at least cause a material difference, generally at least a 5% or $50,000 variance. The channel will be either our own website (.COM) or the digital marketplaces where we sell such as Amazon, Walmart.com, etc.
.COM
If we determine that the variation stems mostly from our .COM then we will traverse down the .COM branch starting with Sales.
Sales
Sales is our starting point as this is often the KPI we care the most about. You can deconstruct sales into two metrics:
Sales = Orders AOV (Average Order Value)
Sales is driven by Orders and AOV so when there is a variation in Sales we first want to check to see if Orders have varied by the same amount as Sales as this will direct us to either check the components that drive Orders or AOV.
For example, if Sales is down 10% and Orders are also down 10% then we need to look at the “what is causing Orders to decline”. If on the other hand Sales is down 10% but Orders are flat then AOV must have changed and thus we need to look at the components of AOV to understand what is driving the change.
This is the first decision point within my operational monitoring tree. Is order volume changing at the same rate as sales? Progress to the AOV branch or the Conversion branch.
Conversion Rate Branch
Traversing to the Conversion Rate, the first question I will have to evaluate is whether or not the reduction in orders is explained by the change in conversion rate by evaluating:
Orders = Traffic Conversion Rate
If the conversion rate did not change at the rate that the orders changed then the traffic must have changed as well. If the conversion rate changed at the same rate at our orders then we have identified the node of the tree that we must investigate.
If traffic has been identified as the driver for the resulting order difference because conversion rate has stayed relatively the same, we then to evaluate the traffic trend and determine if the changes to traffic account for the change in orders.
This results in our having three potential outcomes for describing the change in orders.
- The change in orders can be described by a change in conversion rate (Conversion Rate Node)
- The change in orders can be described by a change in traffic (Traffic Node)
- The change in orders cannot be described by a change in conversion rate or traffic (Data Issue Node)
Site / User Node
Determining that a change in the conversion rate is causing the change in order volume and subsequently sales volume allows us to pinpoint areas that we need to explore as these would be the root causes for creating conversion rate changes by checking:
- Did our traffic mix change?
- Are there changes in device type on our site?
- Are there changes in user-type (new vs. returning) on our site?
- Did we make changes to the site?
- Has our shopping stage dropoffs changed?
- Has our checkflow and dropoff rate changed?
- Are there any out-of-stocks on high-volume products
Each of these questions can result in negative or positive changes in conversion rate.
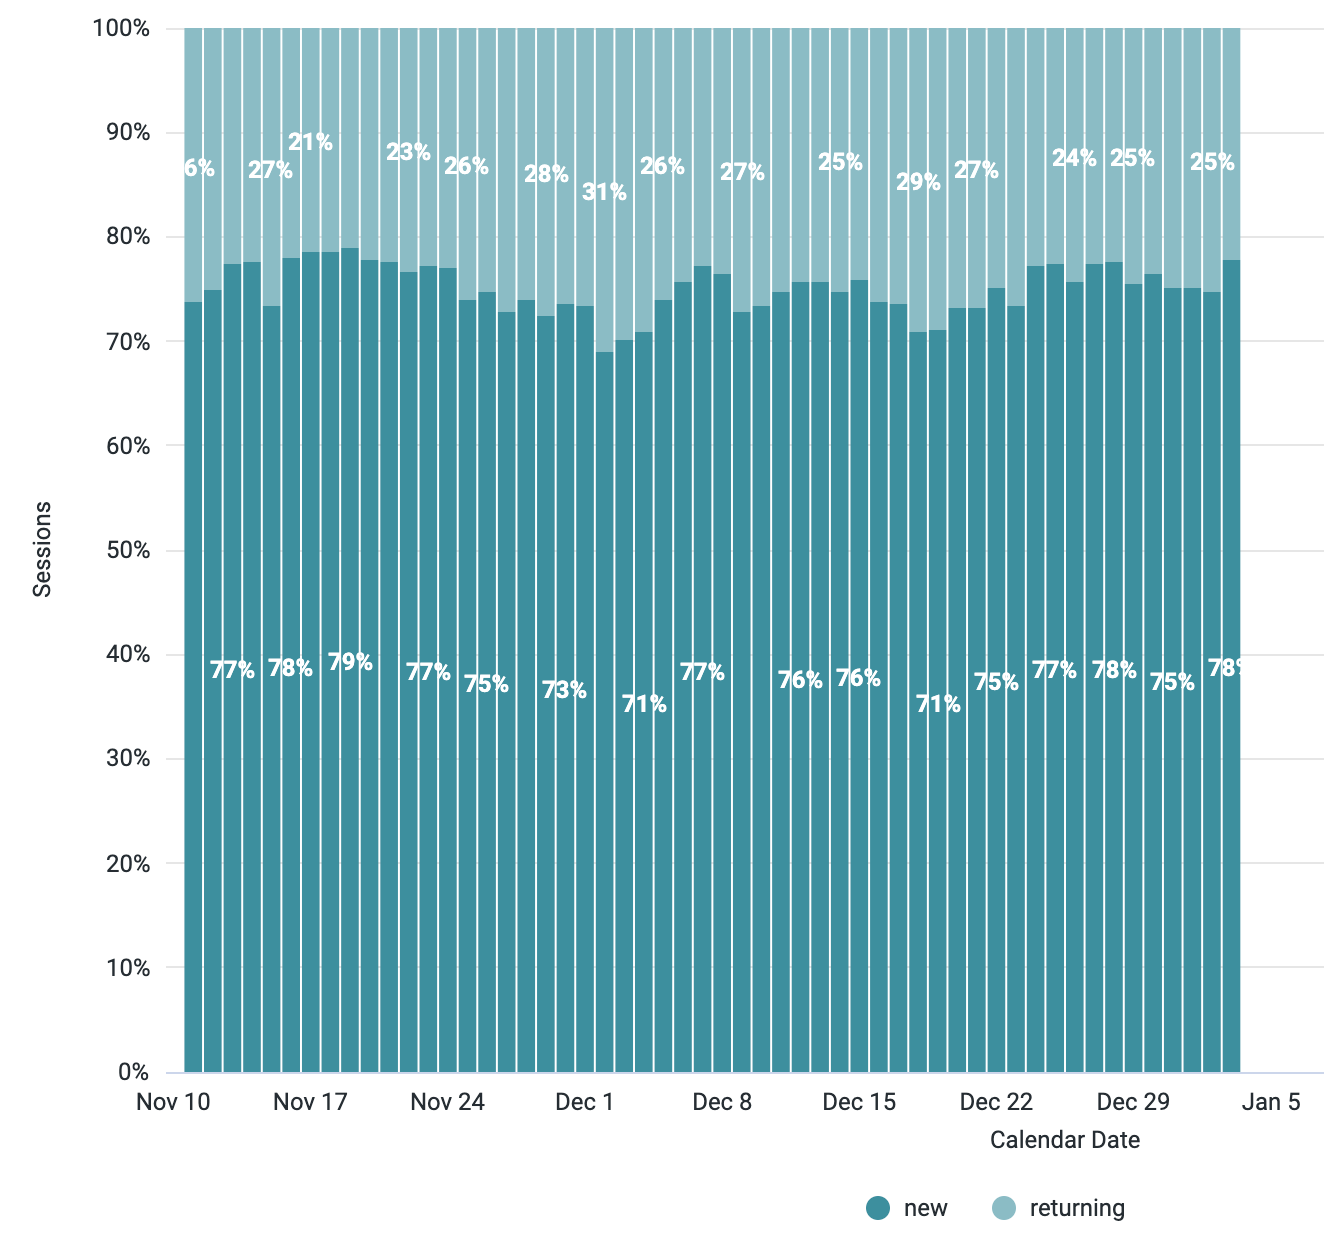
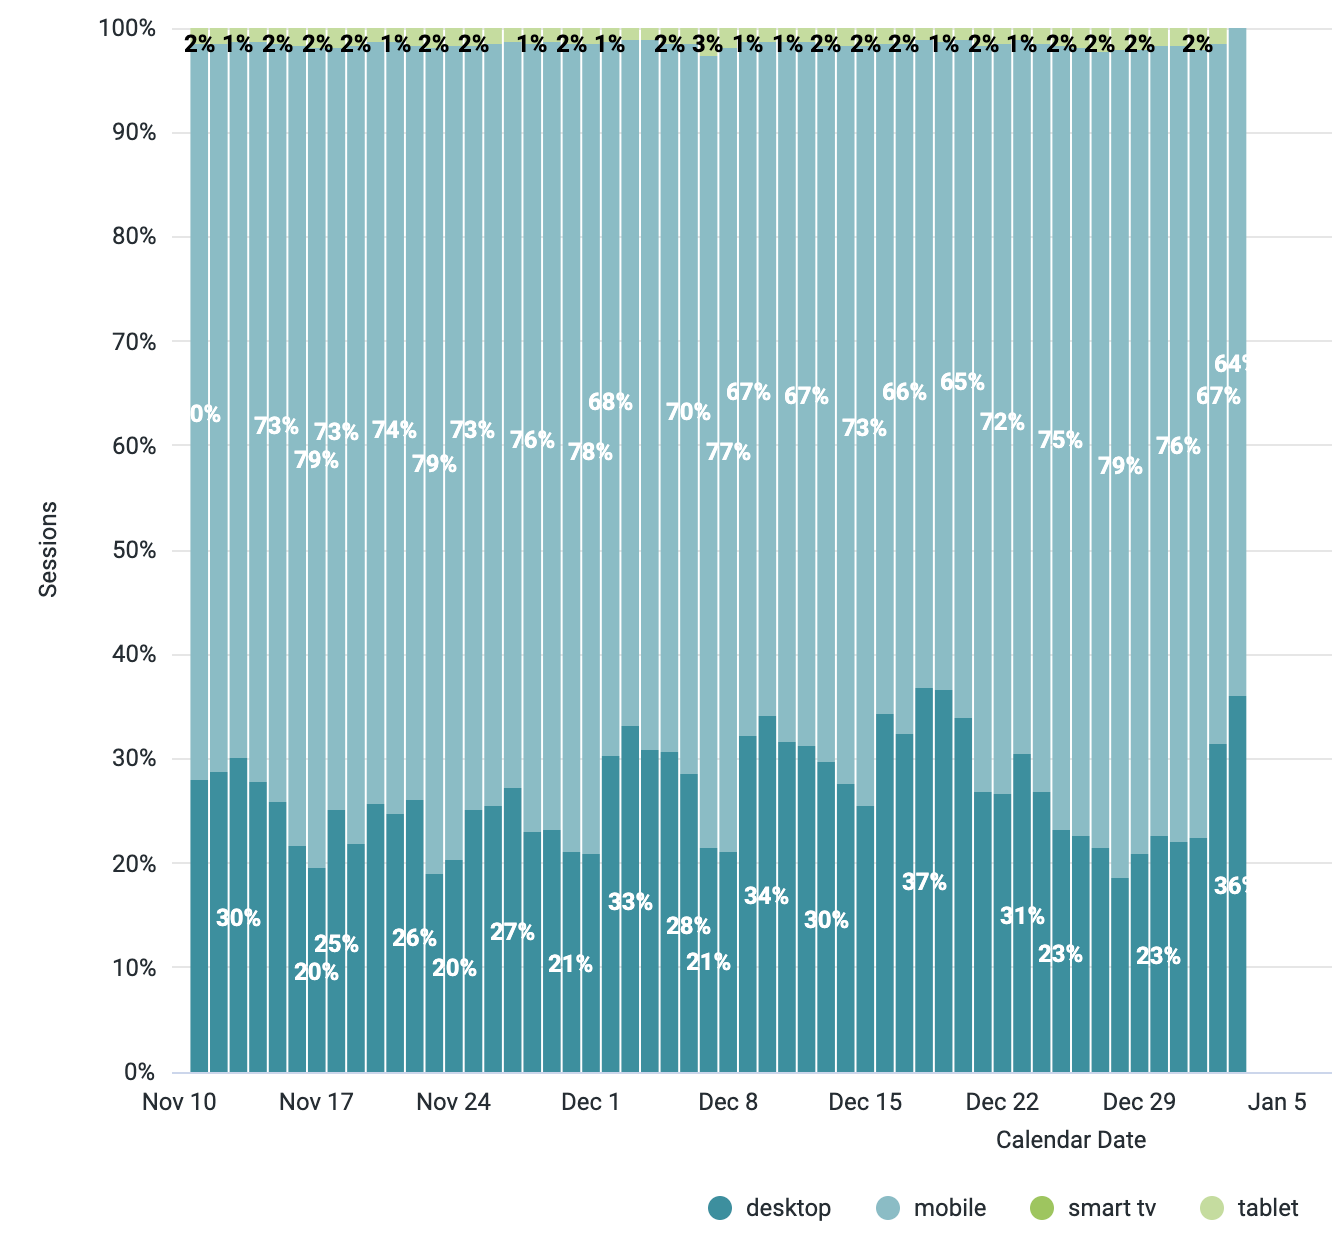
It is good to first check for significant changes to the mix of customers to our site by evaluating if we are getting more mobile traffic and / or a change in user type. As mobile traffic increases we should expect conversion rate to decrease as in general mobile traffic converts at a lower rate due to both challenges in the checkout flow on mobile and the intent to purchase. Similarly if traffic has shifted traffic towards more “new” users then we would also expect a decline in conversion rate as “new” users will have a larger percentage doing research than “returning” that have a higher intent to purchase.
Looks that answer questions above:
- https://daasitypro.looker.com/looks/1188
- https://daasitypro.looker.com/looks/1189
- https://daasitypro.looker.com/looks/1191
- https://daasitypro.looker.com/looks/1192
- https://daasitypro.looker.com/looks/1191
The second resulting reason why conversion rate could change is because of changes to the site including the home page, category pages, product landing pages (PLP) and product detail pages (PDP) can each have an impact on overall conversion rate. The best way to determine which of these is impacting your overall site is to look at your general site conversion by comparing the shopping stage funnel over time.
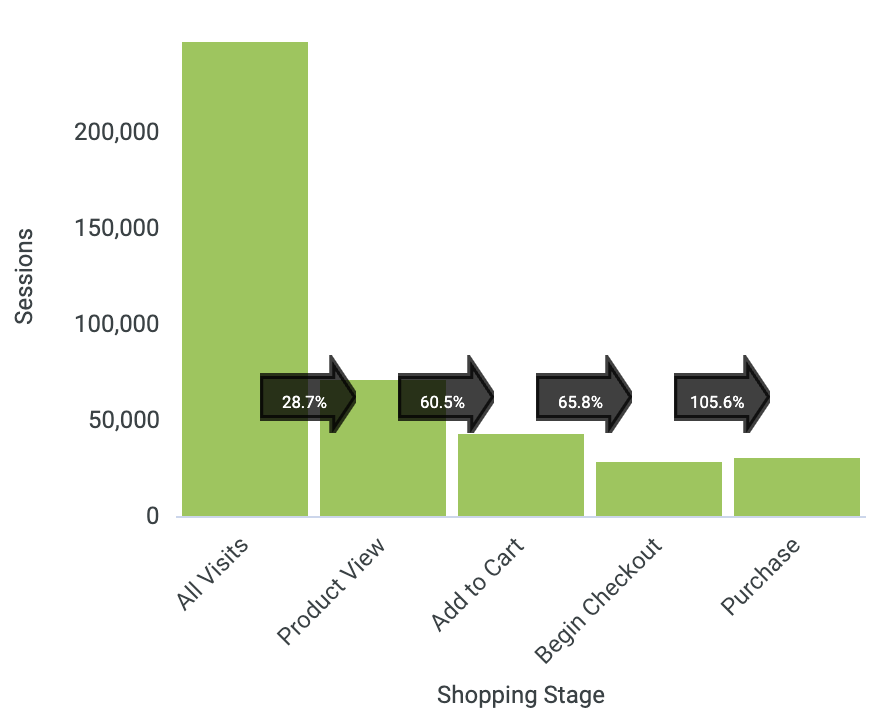
We can use this to determine where our customers are falling off as it must be on one of these stages - customers that have visited moving to a PDP (this triggers a product view) to adding a product to the cart, starting the checkout and then completing the purchase.
This can help us drill into our home page, PDP pages or cart process to drill into details to find if the site is broken or a recent change we have made is driving the change.
Lastly we can drill into PDP performance and compare time periods to find products where the view to buy rate has changed significantly. A common reason for significant changes to PDP view to buy rate changes is out-of-stocks. This is common for apparel, fashion and home accessories brands where being out of stock on certain sizes or colors can have a significant impact on conversion rate as the product is not available.
Addressing these issues may not be a simple task but it clearly helps us identify where in the business we need to focus:
- Acquisition and Retention marketing because our traffic mix has changed significantly
- Site because of significant changes in performance on different stages especially from home page to PDP and then within the checkout flow
- Merchandising because we have key products that are out-of-stock
Traffic Branch
If the change in order volume was not a result of a change in conversion rate then mathematically it must have been a result of a change in traffic. In the situation where we did not see a change in conversion rate or traffic but a change in orders we must evaluate our Data Issue Node which is a common node across all branches.
If the traffic did change significantly then we must evaluate our Source / Spend Node to identify the issues.
Data Issue Node
The data issue node is one where mathematically it should be impossible to end up in this leaf node because only through incorrect math can we end up in this situation. This could be a result of two different reasons:
- Our assumptions for our plan are incorrect and how we built our plan from the components is incorrect. For example, we may have incorrectly calculated our traffic target by using the wrong conversion rate from the order volume we expected.
- Our data is wrong. This could be as simple as:
- An incorrect filter on our reports, including both Amazon and Shopify in our traffic numbers
- An issue with our source replication, missing partial data for yesterday
- An issue with our source, pushing subscription orders in Google Analytics and inflating our conversion rate to include those subscription orders
No matter the reason, we need to investigate to understand if a data anomaly is causing the issue as this could indicate a larger issue that puts our data-driven decision making at risk
Source / Spend Node
Determining that a change in traffic is causing the change in order volume and subsequently sales volume allows us to pinpoint areas that we need to explore as these would be the root causes for creating traffic changes by checking:
- Did our traffic volume change?
- Are there changes to our traffic by channel?
- Did our paid marketing spend change?
- Did our email / SMS campaign volume change?
Each of these questions can result in negative or positive changes to traffic volume.
First we should evaluate the traffic by channel to see if there are significant changes from a particular channel, especially non-paid channels where we have less control over volume. Identifying significant changes here can help us understand the root cause such as:
- A social post has gone viral
- We got mentioned in the media
- An email or SMS campaign didn’t deploy properly
Examining the traffic by channel helps us evaluate which channel we need to dig into and find the root cause.
We should evaluate changes in marketing spend when we identify changes in traffic from paid marketing channels (Paid Search, Paid Social, etc.). As these channels often see traffic be correlated with spend we can identify if we have made significant changes to this strategy and that is impacting our performance. We can further drill into specific paid marketing performance if we identify paid marketing channels as the source and work to address the underlying problem with our paid marketing campaigns.
Lastly we can examine email / SMS volume to understand traffic variations as it is a common practice to not send bulk campaigns daily. Bulk campaigns trend to drive significant traffic and must be tracked as can be a common source for large variations in traffic volume. It is good to include both automated and bulk campaigns together as although automated campaigns have lower volume they tend to have higher engagement and thus can contribute significantly to the traffic variations.
Looks that answer questions above:
AOV Branch
If the change in revenue is not correlated to a change in orders then the resulting revenue change must be driven by a change in average order value (AOV) because:
Revenue = Orders * Average Order Value
This change in AOV can be a result of either average unit retail (AUR) or units per transaction (UPT) because we decompose AOV as follows
Average Order Value (AOV) = Average Unit Retail (AUR) Units Per Transaction (UPT)
Thus the change in revenue must be linked to either a change in our average price or the number of items that customers purchased in each order. This allows us to have three potential outcomes for describing the change in revenue as a result of AOV:.
- The change in AOV can be described by a change in AUR (Site / Merchandising / Offer Node)
- The change in AOV can be described by a change in UPT (Site / Merchandising / Offer Node)
- The change in orders cannot be described by a change in AUR or UPT (Data Issue Node)
Looks that would be used here:
Site / Merchandising / Offer Node
A change in revenue that is a result of a change in AOV regardless of being driven by an underlying change in AUR or UPT is often a result of the same root causes and thus generates a number of questions that we must answer to determine the exact reason. We must investigate these reasons:
- Did our discount offer change?
- Is the volume of orders with discount codes changing?
- Is there a change in our discount offer?
- Did we implement a promotional offer?
- Is there an offer with an order threshold such as free shipping or gift with purchase?
- Did we change how we have merchandised our site?
- Is there a significant shift in our product mix?
Each of these questions can have a significant impact on both AUR and UPT and thus would drive a significant change in AOV.
It is good to first check for changes to discount code volume as this can highlight a potential leakage or viral distribution of a discount code, especially when a high discount offer has been sent to a targeted audience. Changes to AUR can be driven both by discount codes but also from a skew in purchase behavior and thus we must also look at the distribution of item order volume by price brands to determine if the AUR change is being driven by a mix in products and not by offers. Product mix changes are best viewed at an aggregate level based on division, class, category or sub-category depending on how products are categorized. Viewing changes at the aggregate level and then drilling into the details can identify the category that is driving the variance which could be a problem on the site with that category, such as issues with PDP pages not working properly, not being able to add to cart or showing no inventory.
Changes to UPT when AOV also changes are often linked to stock-outs as the customer is unable to find the product they want and thus purchase fewer items. It is not uncommon to see UPT increase when discounts are applied and AUR decreases as customers are focused on the total cart cost and thus will purchase more items when the items have been discounted.
Looks that would be used here:
- https://daasitypro.looker.com/looks/1199
- Discount code comparison over time
- https://daasitypro.looker.com/looks/1200
- Product mix change reports
Amazon
If we determine that the variation stems from our Amazon business then we traverse down the Amazon branch. The tree structure, branches and nodes are the same between our .COM and Amazon but the questions we investigate at the nodes will differ slightly because Amazon both behaves differently from a consumer purchase perspective and the information we can analyze with Amazon is different.
Thus we will still answer the same questions at each decision node to get to four similar potential end nodes as we do in the .COM:
- Site Node
- Spend Node vs. Source / Spend Node
- Site / Offer / Merchandising Node
- Data Issue Node
Site Node
We receive very little information about the type of traffic to our product listing on Amazon that impact conversion rate but can investigate three key drivers that will directly impact performance:
- Did our buy-box percentage change?
- Are we out-of-stock on any key products?
- DId our product listings change?
First we need to understand if our buy-box percentage changed as this will have an immediate impact on our performance. Customers will tend to choose the default seller for an item on Amazon and thus if anyone resells your product on Amazon there is potential that your will not win the buy-box and that another seller will capture the sale. Tracking buy-box performance is key to ensuring that you capture the sales on your product page.
Amazon provides a simple buying experience and thus understanding changes to product listing and conversion is fairly simple as one just needs to compare product buy rates over time to understand if there is a significant change in the conversion rate for certain products. Changes at the product level could be driven by either changes to the product listing itself that need to be investigated or potentially out-of-stock which would also result in decreased conversion rates.
Looks that would be used here:
Spend Node
With little control over directing traffic to Amazon, we are more impacted by traffic to our brand or product pages within Amazon and being able to ensure that consumers see our product when looking for certain products within Amazon.
Our ad spend on Amazon will impact traffic to our brand / products and thus tracking the performance and mix of spend on sponsored product, sponsored brand and sponsored display will help us understand if a mix in ad spend is driving overall traffic changes. If we identify that a specific ad type has changed then we can drill into specific campaign performance to understand what we need to correct.
Looks that would be used here:
Site / Merchandising / Offer Node
In Amazon the cart can be multi-brand and thus the concept of AOV does not apply to us as the brand but only to Amazon. Instead we focus directly on AUR and UPT and need to understand what might drive AUR and UPT. The questions we must answer are:
- Did our coupon offer change?
- Is the volume of items purchased with a coupon changing?
- Is there a change in our coupon?
- Did we change our product pricing?
- Has our product mix changed?
Similar to .COM we need to evaluate trends on coupon usage which may be linked to virality of a campaign that contains our codes. We need to examine changes to our product pricing and also the distribution of items sold at different prices to evaluate if this change in pricing or skew in price ranges changes the AUR.
Authors

Dan LeBlanc

