
On July 1, 2023, Google Analytics 4 (GA4) is replacing Universal Analytics. Goodbye, old friend.
Coming with the replacement are significant changes to data, metrics (like sessions), and reporting along with expanded or added features (like the ability to export data to BigQuery).
Joining the feature expansion are changes to attribution, including a powerful new type of attribution called Data-Driven Attribution…and we’re pretty excited about it.
Old & New: adding Data-Driven Attribution to the model mix
To avoid any potential panic here, we’d like to first note that Google will maintain its previous attribution model options. Also, most reports (aside from custom reports and the Advertising Snapshot) use a model that’s similar to last-click attribution.
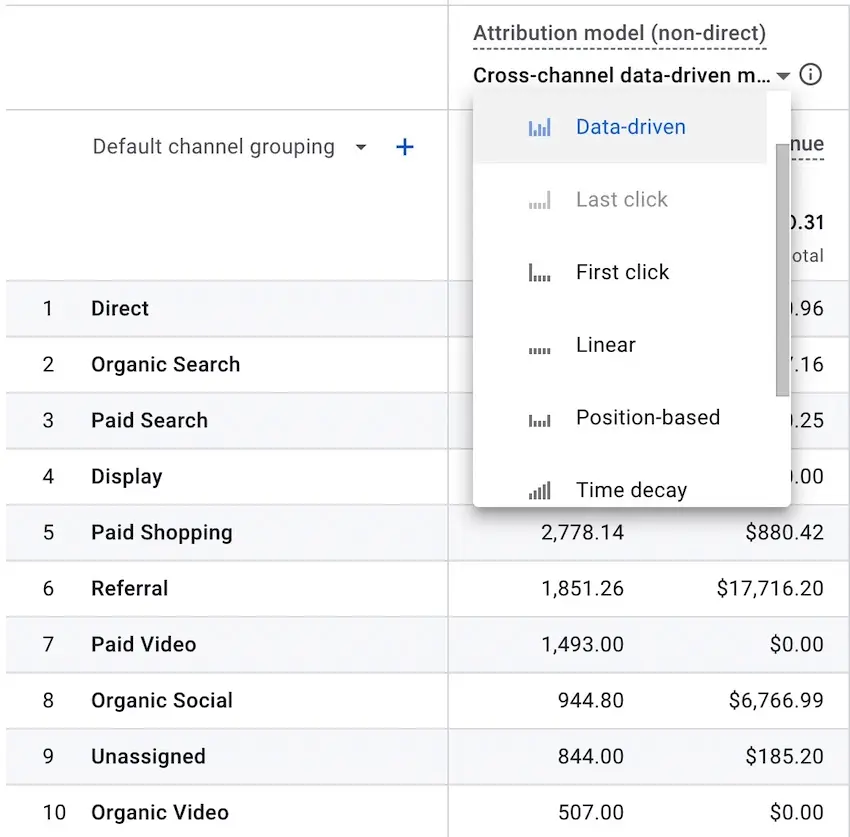
You can still select from the old crew—last click, first click, linear, position based (a.k.a. u-shaped), and time-decay models. However, you can also make the new Data-Driven Attribution your primary model.
What is Data-Driven Attribution?
Data-Driven Attribution is a dynamic attribution model that looks at your users’ source/medium/campaign combinations over their customer journeys and attempts to determine which are most crucial to the conversion.
It uses a weighting system to distribute credit: combinations that were more important toward driving a conversion are weighted more heavily, and less important combinations are weighted less.
Let’s consider the following journey for customer X:
- At 12:00pm, they search “work jeans” on Google. They see one of your ads show up at the top of the SERP, click on the ad, and land on your website.
- At 12:06, after they’ve browsed your site for several minutes, they return to the SERP and explore what some other brands have to offer.
- At 12:21, after spending some time looking through other brands’ products, they decide they prefer your offerings. They go back to Google, search for your brand name, and click on your organic SERP listing to get back to your site.
- At 12:22, after browsing your site for a minute, they find exactly what they’re looking for, they add the product to their cart, and they start to check out.
- At 12:24, they decide to search RetailMeNot for a promotion coupon on your site.
- At 12:25, they find a promotion coupon on RetailMeNot and click on a link to get back to your site.
- At 12:27, they complete their purchase on your site.
In this journey, the path to conversion was:
- Paid search ad click
- Organic search ad click
- Affiliate click
- Conversion
To determine how much credit affiliate should get for this conversion, Google’s machine learning algorithms will look at all similar paths to conversion to determine how crucial the affiliate click was to driving the conversion.
So, the algorithms will consider the conversion rates of users who follow the following paths:
- paid search ad click -> organic search ad click
- paid search ad click -> organic search ad click -> affiliate click
Data-Driven Attribution discussion
Let’s say the conversion probability of users following path 1 (i.e., without the affiliate click) is 5%, and the conversion probability of users following path 2 (i.e., with the affiliate click) is 10%.
In the case of path 2, the affiliate click doubled the odds that the user would convert, so it would therefore receive a larger share of the conversion credit than either the paid search ad click or the organic search click.
If it were the opposite case, and the affiliate click actually decreased the odds of the user converting, it would end up getting a smaller share of the credit when compared with paid search and organic search.
Of course, this example is quite simple, but it covers the principle behind how the Data-Driven Attribution model works.
It can get a bit confusing, however: a single conversion can be associated with multiple traffic sources. More on that next.
Increased reporting complexity
Given the dynamic nature of Data-Driven Attribution, GA4 has made examining conversion data more flexible, but the cost is increased complexity in your reporting.
In Universal Analytics, the basic marketing traffic source dimensions are Channel Grouping, Source, Medium, Campaign. The same is true in GA4, however: there are 3 types of each dimension.
For example, there’s no longer a single Source dimension. There’s now a Session Source dimension, a First User Source dimension, and the standalone Source dimension.
Each of these dimensions has a different scope, and the metrics you combine them with will give you different information:
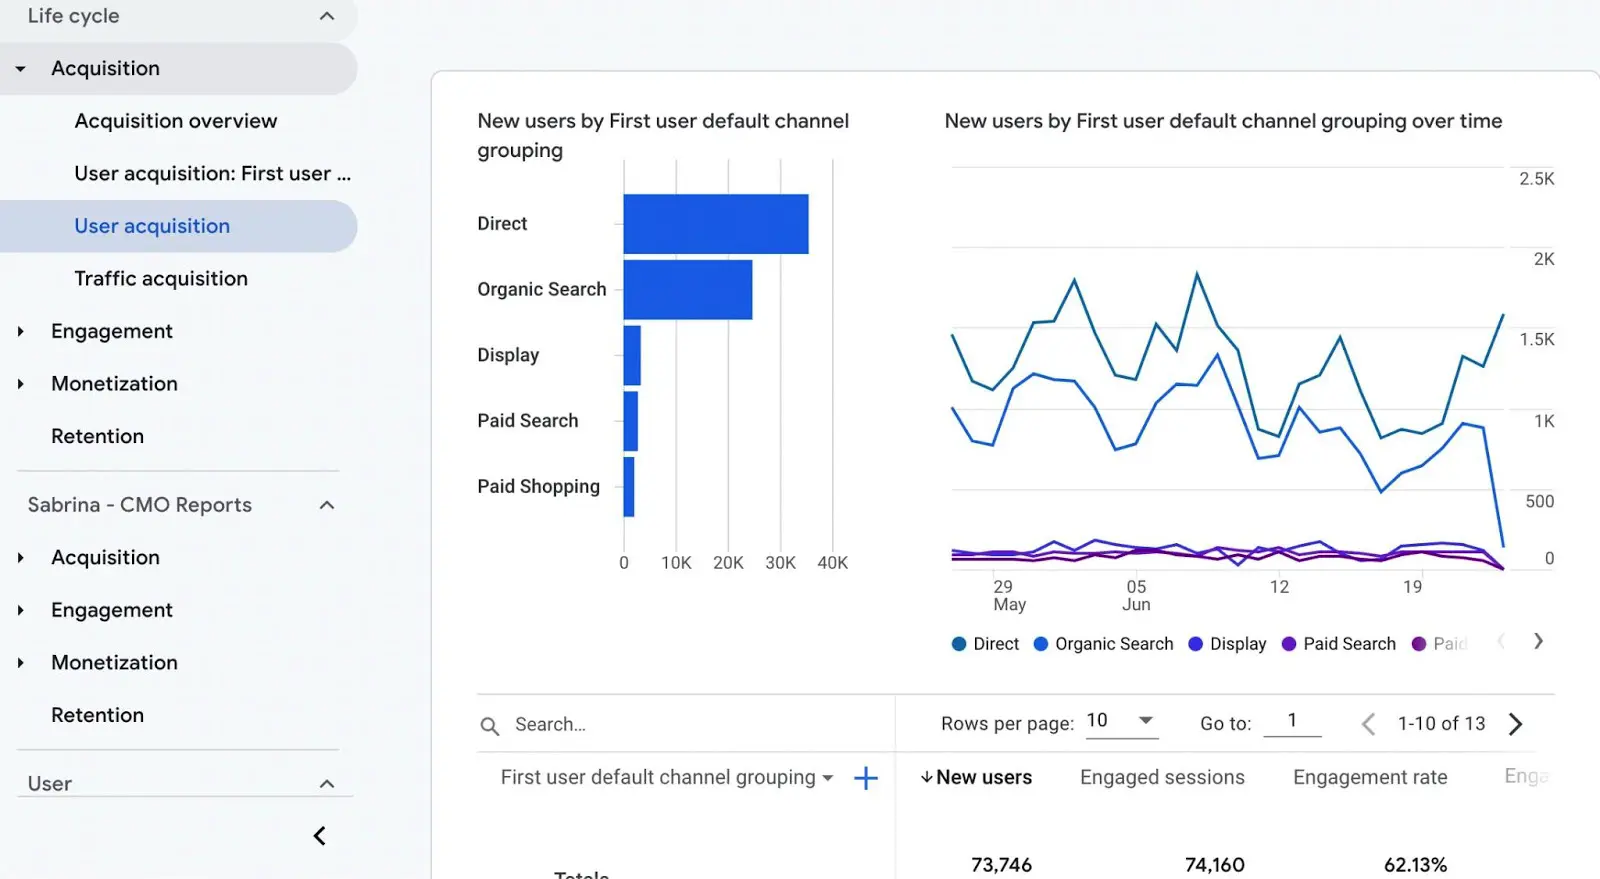
- First User Source: This is the first source ever associated with the user. If a particular user first came to your site through a Facebook link, their First User Source will always be Facebook. First User is the default traffic dimension type in the Acquisition -> User Acquisition report:
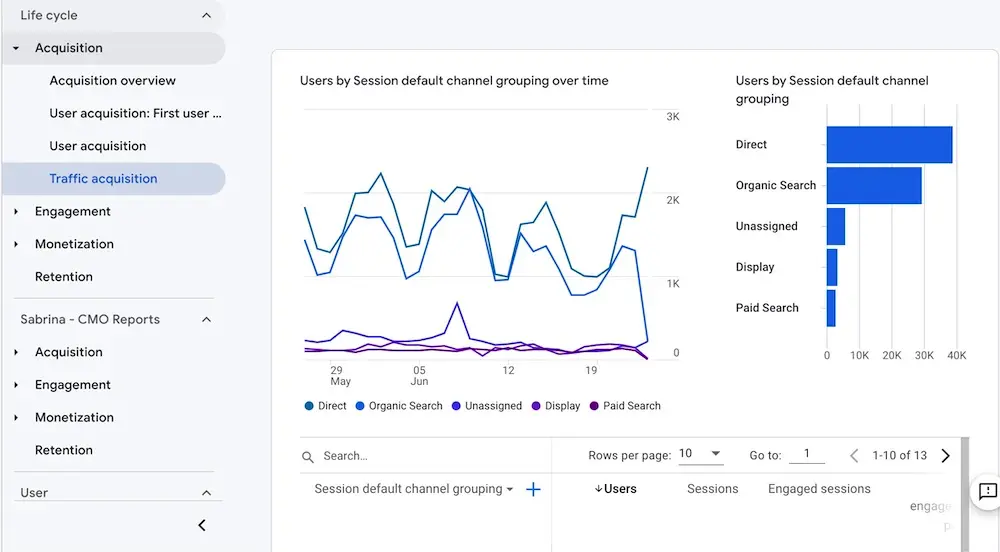
- Session Source: This is the source that initiated the session. In our example user journey with Customer X, the Session Source would be Google because the click that initiated the session was a Google Search ad. Session dimensions are the default in the Acquisition -> Traffic Acquisition reports:
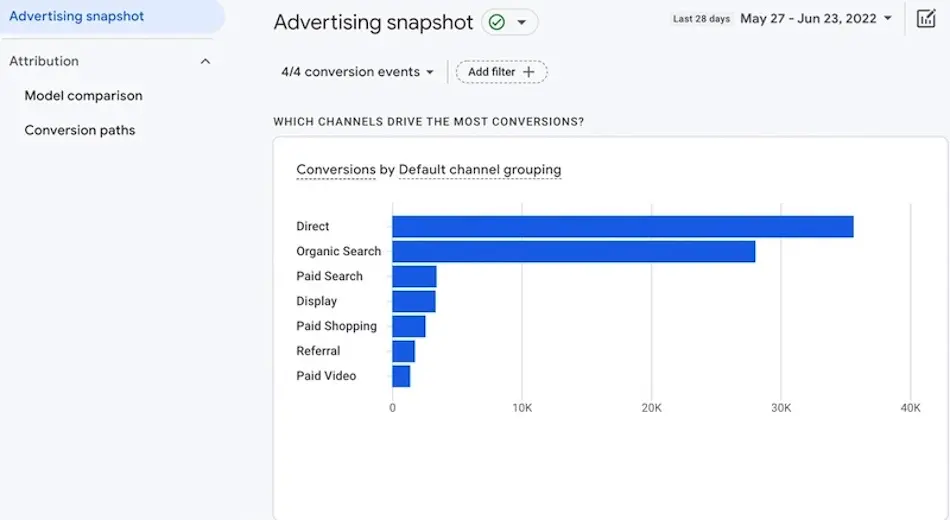
- Source: This is a source that received at least partial credit for a conversion based on your default attribution model. Source is the default dimension exclusively in the Advertising -> Advertising Snapshot report:
Typically, each of these dimensions will give you different results.
Some examples of attributed revenue
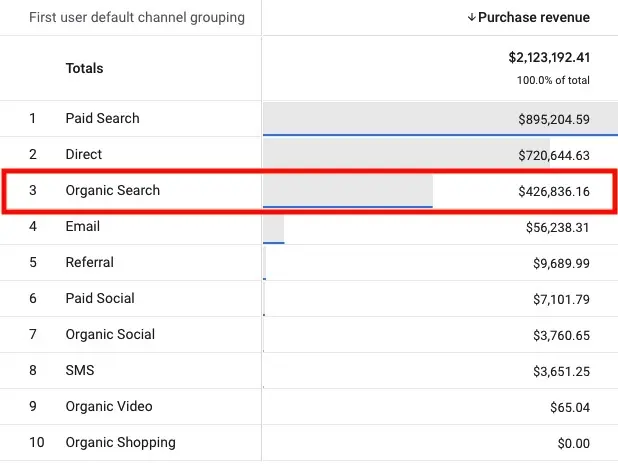
For example, when looking at Default Channel Grouping Organic Search, we get the following results:
1. Revenue from users whose first channel grouping was Organic Search was $426.8k:
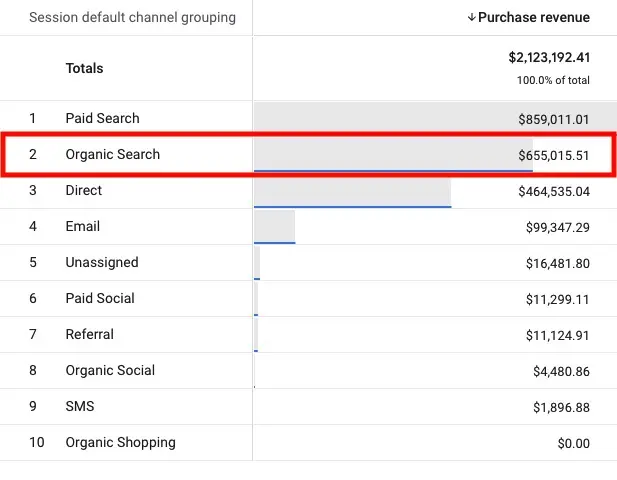
2. Revenue from sessions that were initiated through Organic Search is $655k:
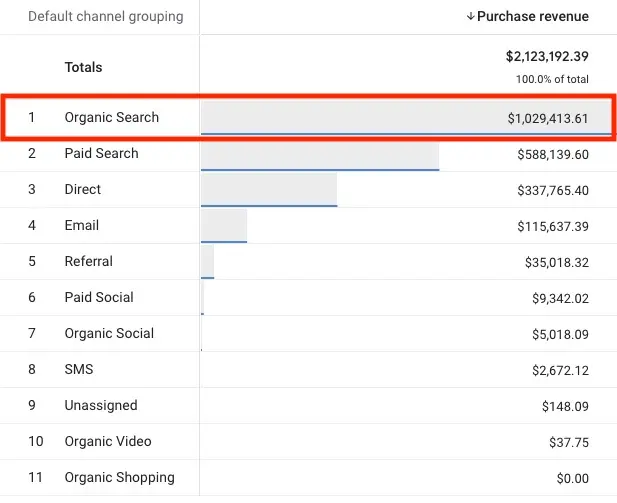
3. Revenue from Organic Search according to the Data-Driven Attribution model was $1.03M:
Daasity’s Analysis
We think it’s great that GA4 users can now analyze their site performance through these different lenses.
That said, it will be incredibly important for members of your team using GA4 to be aware of the implications of using the different traffic dimensions. Two GA4 users thinking they’re looking at the same revenue data broken down by Channel Grouping could in fact be looking at very different things, which means that they might arrive at totally different conclusions.
Going back to our example…Here’s how revenue attribution would differ between Universal Analytics and GA4:
In Universal Analytics:
- 100% of the revenue would be attributed to RetailMeNot, as it was the last non-direct click before the purchase happened. This would be the case in all reports aside from the model comparison tool.
In GA4:
- When looking at first user channel grouping, 100% of the revenue would be attributed to Paid Search.
- When looking at session channel grouping, 100% of the revenue also would be attributed to Paid Search.
- When looking at channel grouping, some fraction of the revenue would be divvied up between Paid Search, Organic Search, and Affiliate (RetailMeNot), depending on how important each of those touchpoints were judged to be by the DDA algorithm
Takeaways and conclusion
The biggest takeaway here is if you’re trying to get your Universal Analytics & GA4 data to match up perfectly…
Don’t.
There are fundamental changes to how GA4 handles attribution. Therefore, it’s not in your best interest to try to get your data to match between the two versions of Google Analytics. It’s better to shift your expectations, understand the caveats of the new model, and roll with it—that’s what we’ve done, too!
On the bright side, we believe that, by and large, the attribution changes in GA4 are good.
In Customer X’s journey, the traffic source that initiated the session would receive all the credit when looking from the Session Source lens, and it would get a % of the revenue credit through the Source lens in the Data-Driven Attribution model.
In the same scenario in Universal Analytics, that traffic source wouldn’t have gotten any credit outside of the model comparison tool reports. Traffic sources at the very bottom of the funnel will get slightly less credit in this new model. And that might not be a bad thing.
%20(1).png)
