Analyzing and evaluating Prime Day performance is equally important as preparing for it in the first place.
To us, at least in part, they're one and the same.
Digging into your Prime Day Data (Prime Dayta?) and learning more about your performance will enable you to better prepare for next year’s Prime Day.
But how should you go about analyzing that performance? What data categories and Amazon reports should you review? Or, if you’re technical, what API endpoints should you extract from?
We’ve got you covered here.
#1: Sales & Traffic Performance
How to Access This Data
Via Amazon UI: Amazon Seller Central Home > Left Navigation Bar > Reports > Business Reports > “Sales and Traffic”

Programmatically via the SP-API: This data can be requested via the Vendor retail analytics reports, as two separate reports (Rapid Retail Analytics Traffic + Rapid Retail Analytics Sales reports).
How to Analyze This Data
Your sales and traffic data should be your starting point for Amazon data. Ultimately, this allows you to answer a couple fundamental questions about your Amazon presence:
Are customers visiting your product pages (PDPs) and your in-Amazon brand store?
You should track the traffic volume of your PDPs from around and on Prime Day. The goal: an uptick in traffic. If not, customers weren’t finding your products organically or via your ads.
Dig into both.
We’ll cover Amazon ads later in this piece, but on the organic side, less organic traffic than expected might indicate a problem with your Amazon SEO. Amazon SEO factors in different variables than search engines’ SEO. For instance, Amazon will list products higher if they have higher traffic and conversion rates.
- Other Amazon SEO variables include price compared to competitors (big differences may penalize your rank), inventory levels (your products can’t be out of stock), and relevant keywords (much like standard SEO).

Next: A sometimes-neglected traffic element is brand store traffic (example of ALPAKA’s brand store above).
Customers familiar with your brand will search for your brand store in the same way that they would search for and explore your DTC site, and new customers may find your site via Sponsored Brand Ads (example below, from think!, whose brand store appears from the query “high protein bar”).

Again, higher traffic numbers is a sign of overall Prime Day success, but the overall question remains…
Are they buying?
Higher traffic to PDPs and your brand store are positives, of course, as it means there is interest in your products. Of course, the traffic doesn’t actually matter in the end unless it’s leading to purchases.
Note: Prime Day conversion rates will be lower than your standard Amazon conversion rate due to the increase in traffic.
The clear indicators of success here are that overall and relative sales have increased over Prime Day. If they haven’t, or they haven’t increased as much as you projected them to, it is necessary to explore why.
Here are some guiding questions:
- Do your Product Listing names accurately reflect the products themselves?
- Did certain popular ASINs run out of stock? Or, did they run low?
- Were competitors’ products priced lower than yours?
- Has there been a recent spate of negative reviews?
- Did your Amazon SEO suffer during Prime Day?
- Are you leveraging A+ Content?
- Did you have any fulfillment issues prior to Prime Day?
#2: Profitability (Amazon Settlement Reports)
How to Access This Data
Via Amazon UI: If you’re looking to check out single settlement reports in the UI, the path is Amazon Seller Central Home > Left Nav > Reports > Statement View. There, Amazon breaks down individual settlement periods into a P&L:

If you’re looking to download reports, the path is Amazon Seller Central Home > Left Nav > Reports > Payments > All Statements.

Programmatically via the SP-API: Amazon settlement reports cannot be programmatically requested. Amazon generates settlement reports approximately every two weeks, but this may vary.
How to Analyze This Data
(A Bit of a Settlement Report Preamble:)
Analyzing Amazon settlement reports has been a bugbear for brands since time immemorial (or, at least since Amazon standardized P&Ls for sellers).
Settlement reports present a couple annoyances for brands trying to get an understanding of their Prime Day profitability.
- There is no way to visualize more than one settlement report at a time in the Amazon Seller Central UI.
- Full profitability across your selling regions will, as with all reports, require manually rolling up your data into an overall view.
As a result, gaining a clear view of Prime Day profitability, ranging from the high level to the granular, will likely require data infrastructure beyond spreadsheet downloads—especially if the goal is to understand something like SKU/ASIN-level profitability:

The Original Point of This Section:
We’ve given the settlement report its own section in this piece because even if you see great success over Prime Day from a sales & traffic point of view, it’s all for naught unless you’re profitable.
Questions to guide your Prime Day settlement report analysis:
- (The fundamental question: Did you actually make more money on Prime Day versus a standard two-day period?)
- How much of your revenue was driven from ads?
- How much of your sales were discounted?
- Was your year-over-year profitability higher or lower?
- What were your most and least profitable SKUs?
#3: Inventory
How to Access This Data
Via Amazon UI: Amazon Seller Central Home > Left Nav > Inventory > Dashboard [Under Fulfillment by Amazon (FBA)]

Programmatically via the SP-API: This data can be requested via the Fulfillment by Amazon (FBA) Report Type Values, specifically the FBA Manage Inventory and FBA Manage Inventory - Archived reports.
How to Analyze This Data
Having sufficient FBA inventory, in general, must be a top priority for sellers. A general guideline is to have 4-5 days of inventory to cover Prime Day.
- While too much inventory isn’t great, it’s better to have more than less. The additional inventory not only covers the spike in sales over Prime Day but after Prime Day, too.
Without sufficient inventory, Amazon may financially penalize you, and it will stop listing inventory-less products in SERPs, which eliminates the potential for new customers to even learn about your brand.
During Prime Day, this is a disaster, and translates to substantial lost sales. Further, financial penalties will eat into your margin.
Questions to guide your Prime Day settlement report analysis:
- Did you have enough overall inventory?
- Which product(s) did you have the most/least success forecasting demand for? Why?
- Which SKUs/ASINs were the most/least depleted?
- How did your inventory preparation compare to last year and/or the past two years?
#4: Advertising Performance
How to Access This Data
Via Amazon UI: Amazon Seller Central Home > Left Nav > Advertising > A+ Content Manager

Programmatically via the Amazon Ads API: To get a full view of your advertising performance, you will need to call a couple dozen endpoints from the Amazon Ads API.
How to Analyze This Data
Strong ad performance is necessary for overall Amazon success (funny how that works, eh?), as higher sales for an individual product directly influences its ranking ability on Amazon. The more it sells, the higher it ranks.
Questions to guide your Prime Day ads performance:
- How much revenue did ads generate?
- How many orders did ads generate?
- Were you getting organic Amazon traffic to your PDPs, or were you paying for it?
#5: Discounting
How to Access This Data
Via Amazon UI: Overall discount reporting doesn’t exist in the ASC UI. You can see individual SKU Pricing via Amazon Seller Central Home > Left Nav > Pricing > Manage Pricing.
Programmatically via the SP-API: To extract discounting/promotional data, you will need to call endpoints from Performance Report Type Values. Specifically, the Promotions Performance Report and Coupons Performance Report. To derive insights, you will need to leverage a data transformation layer.
How to Analyze This Data
Customers are looking for major deals on Prime Day, and you likely participated in the discount spree, in order to drive sales volume further.
But were your discounts effective?
Questions to guide discount analysis:
- What percentage of your overall sales and number of orders were discount-driven?
- What promotions did the best? Why might that be?
- What discounts were on products whose PDPs had the highest and lowest conversion rates?
- Back to the settlement report: Did your discounts/promotions drive more profitability than last year?
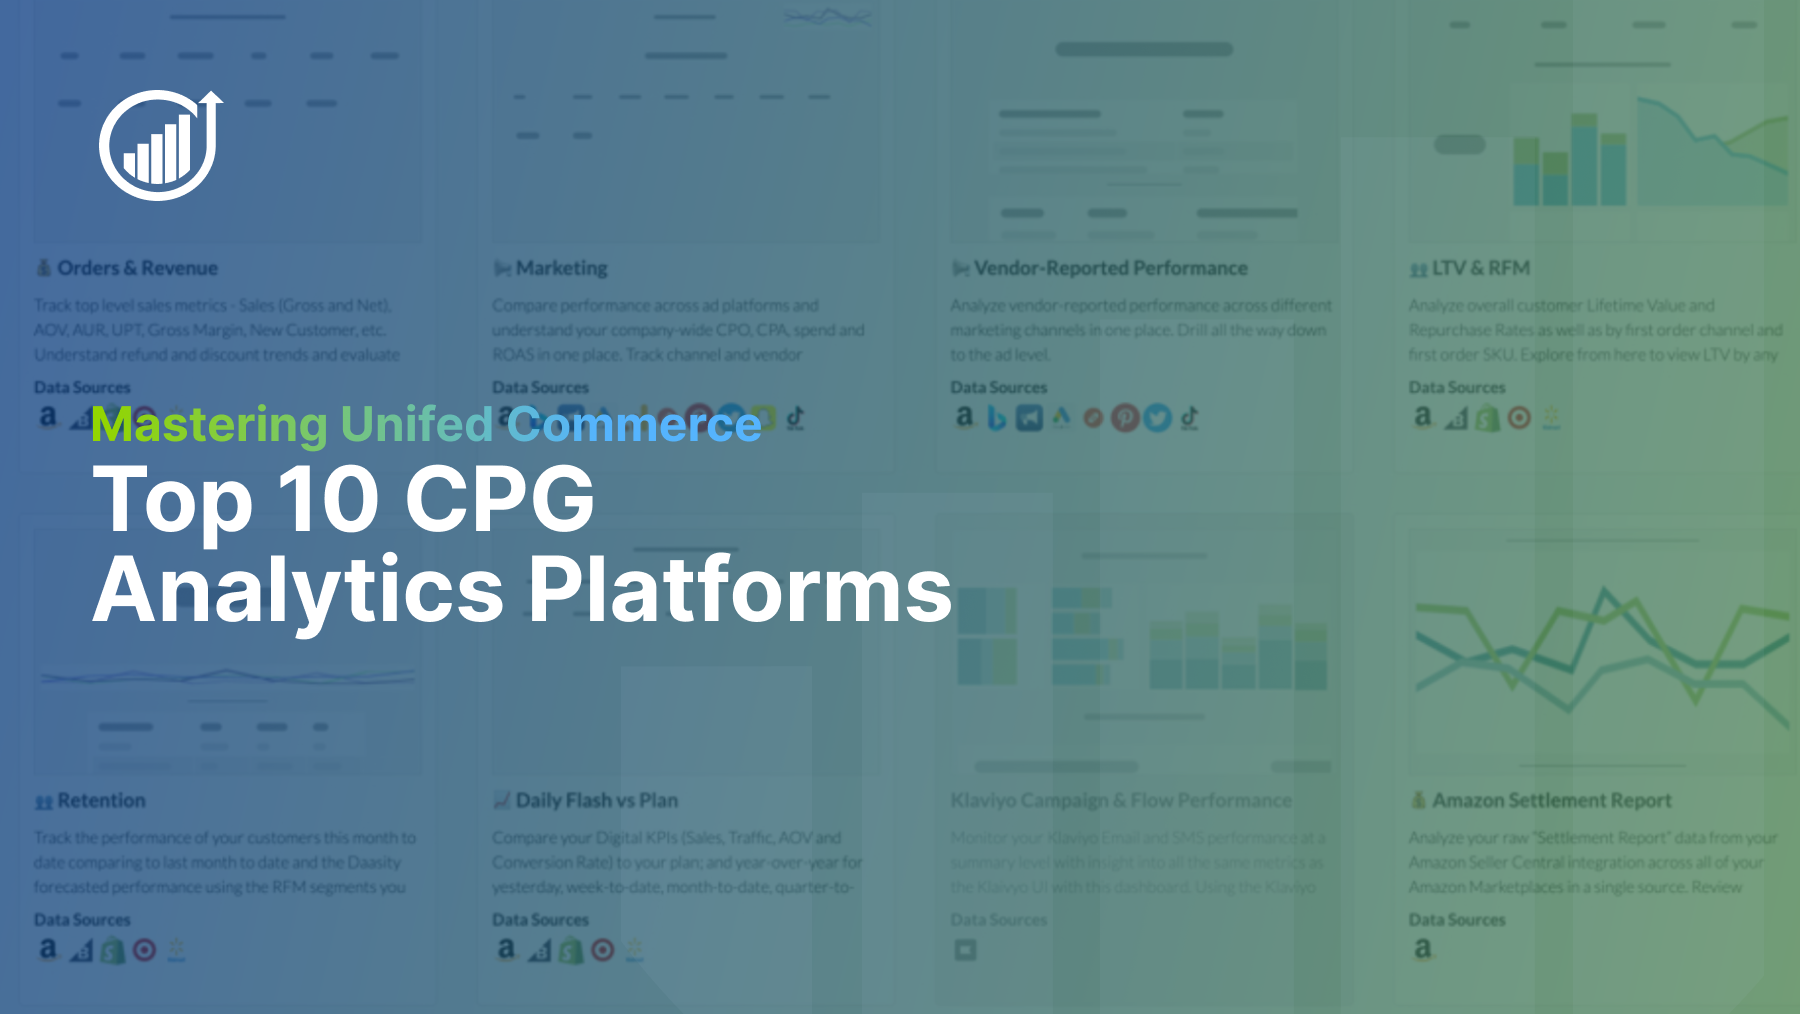
Running Prime Day Analytics (& All Other Omnichannel Analytics) with Daasity
Daasity supports the data analytics and infrastructure needs of omnichannel consumer brands, and we have the strongest Amazon Seller Central integration around.
Via our customizable dashboards, you can analyze all elements of your Prime Day performance, including all data points and reports touched on in this article—ranging from high-level traffic data to SKU/ASIN-level profitability.
- If you’re technical or have technical resources, you can build fully-from scratch reports based on our data model. Here’s our Amazon documentation.
- If you need (or need to offload) some technical work, we can also help build fully custom reports via our Data & Analytics Agency.

With Daasity, though, you can analyze your DTC, retail, and wholesale (or, if you prefer, brick-and-mortar & selling-to-retail data) too, in order to get a holistic view of your brand performance.
We’d love to answer any questions you may have or show you a demo, but if you’re not ready to chat, we have plenty of Amazon content that might strike your fancy.
- How to extract your Amazon Seller Central data
- Everything you need to know about Amazon advertising
- How Amazon SEO works