
Extracting Your Amazon Seller Central Data
If you’re selling on Amazon, you already know that getting all the Amazon Seller Central data you need for a complete picture of your business is challenging (and may seem downright impossible), especially if you’re a large brand with international distribution.
We’ve been there.
To make the seemingly impossible possible, we wanted to create a guide that shows how to get your Amazon seller data, as well as the various quirks that you need to be aware of within Amazon in order to develop a reliable data reporting system.
The Big Three Amazon Data Sources:
Data Source One: Your Amazon Seller Central Dashboard & Visualizations
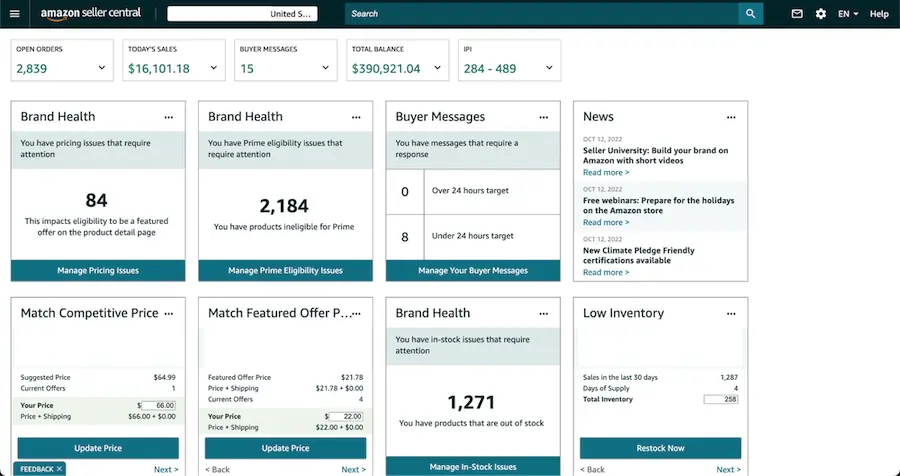
When you use it: The Amazon Seller Central Dashboard gives you a high-level view of your store’s performance and inventory status. If you’re trying to get a quick idea of high-level figures, this is the place to start. Amazon provides simple visualizations for sales, traffic, and orders:
How you use it: You can access the Amazon Seller Central Dashboard simply by logging into your Seller Central account.
Why you use it: This is where the non-data-analytics folks on the team will start their journey to get a snapshot of performance, manage the account, and potentially identify any high-level issues, such as unexpected drops in orders. But all the analytics pros out there know you’re barely scratching the surface here.
Data Source Two: Exported Data Reports
When you use them: You can download reports through Amazon Seller Central to get detailed data on Orders, Inventory, Traffic, and Returns.
How you use them: Export your brand’s data reports through Amazon Seller Central (see two data report examples below for navigation information).
Why you use them: When you want a granular view into all elements of your Amazon data, exported data reports are most sellers’ best bet. You can view and analyze the major categories, and also get more specific data reports, such as Unshipped Orders, Sales, and Traffic by ASIN.
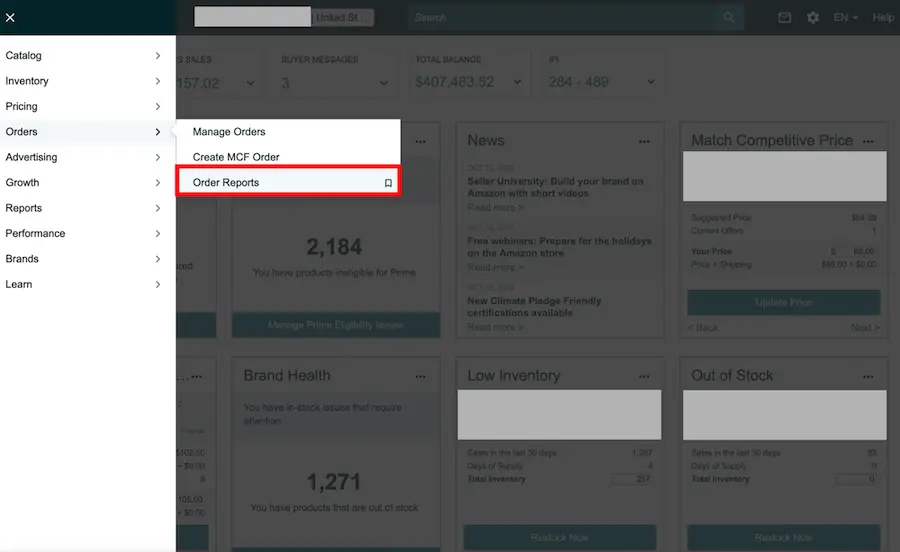
Data Report Ex. #1: New Orders Report
Navigation: Amazon Seller Central > Sidebar > Orders > Orders Reports

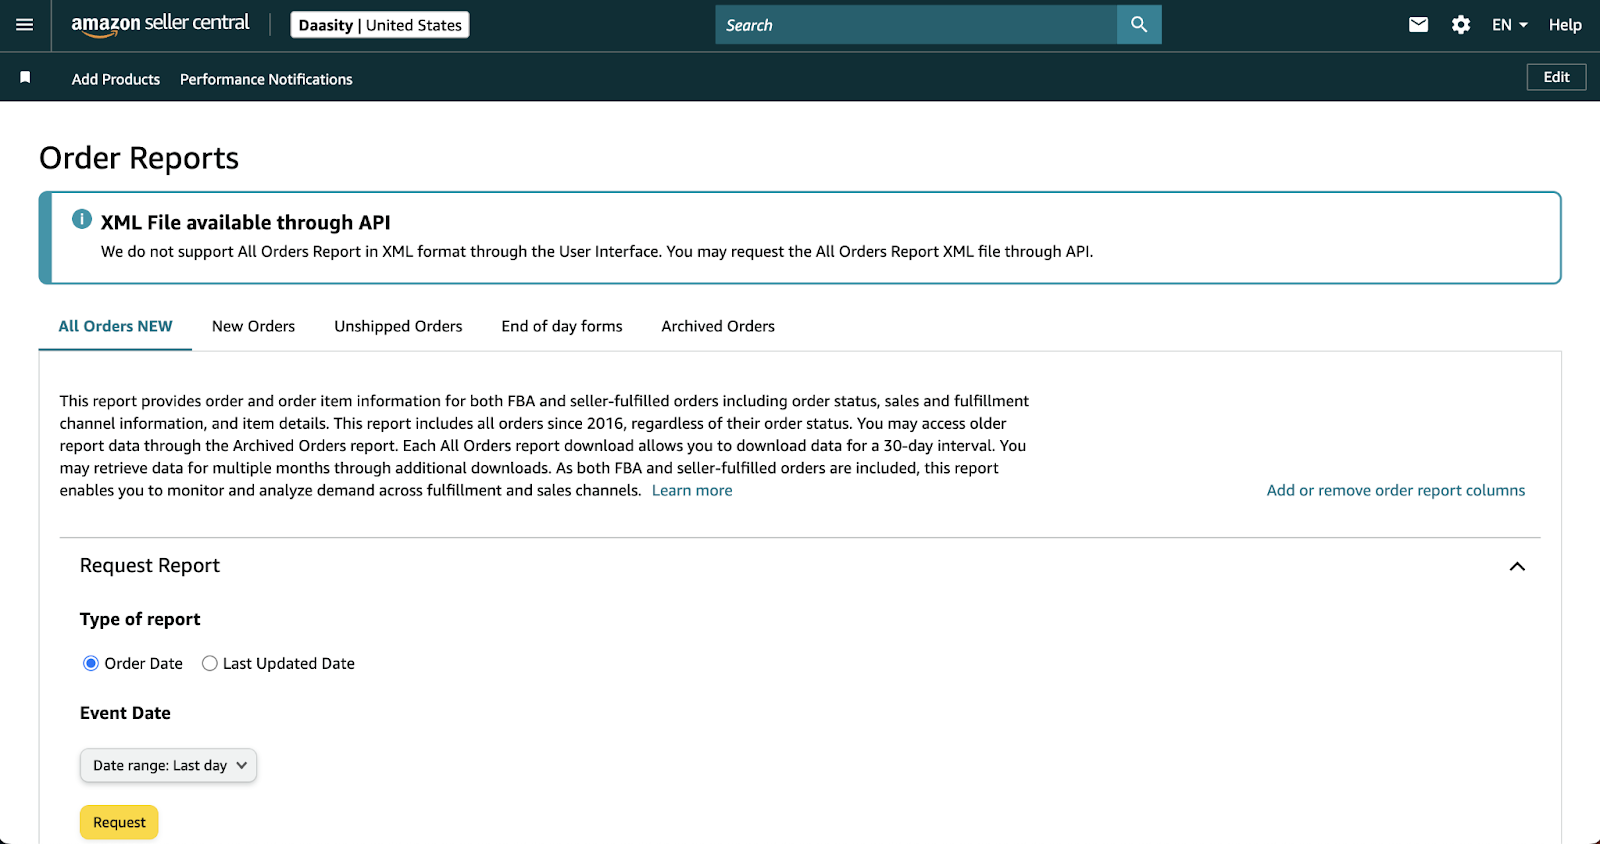
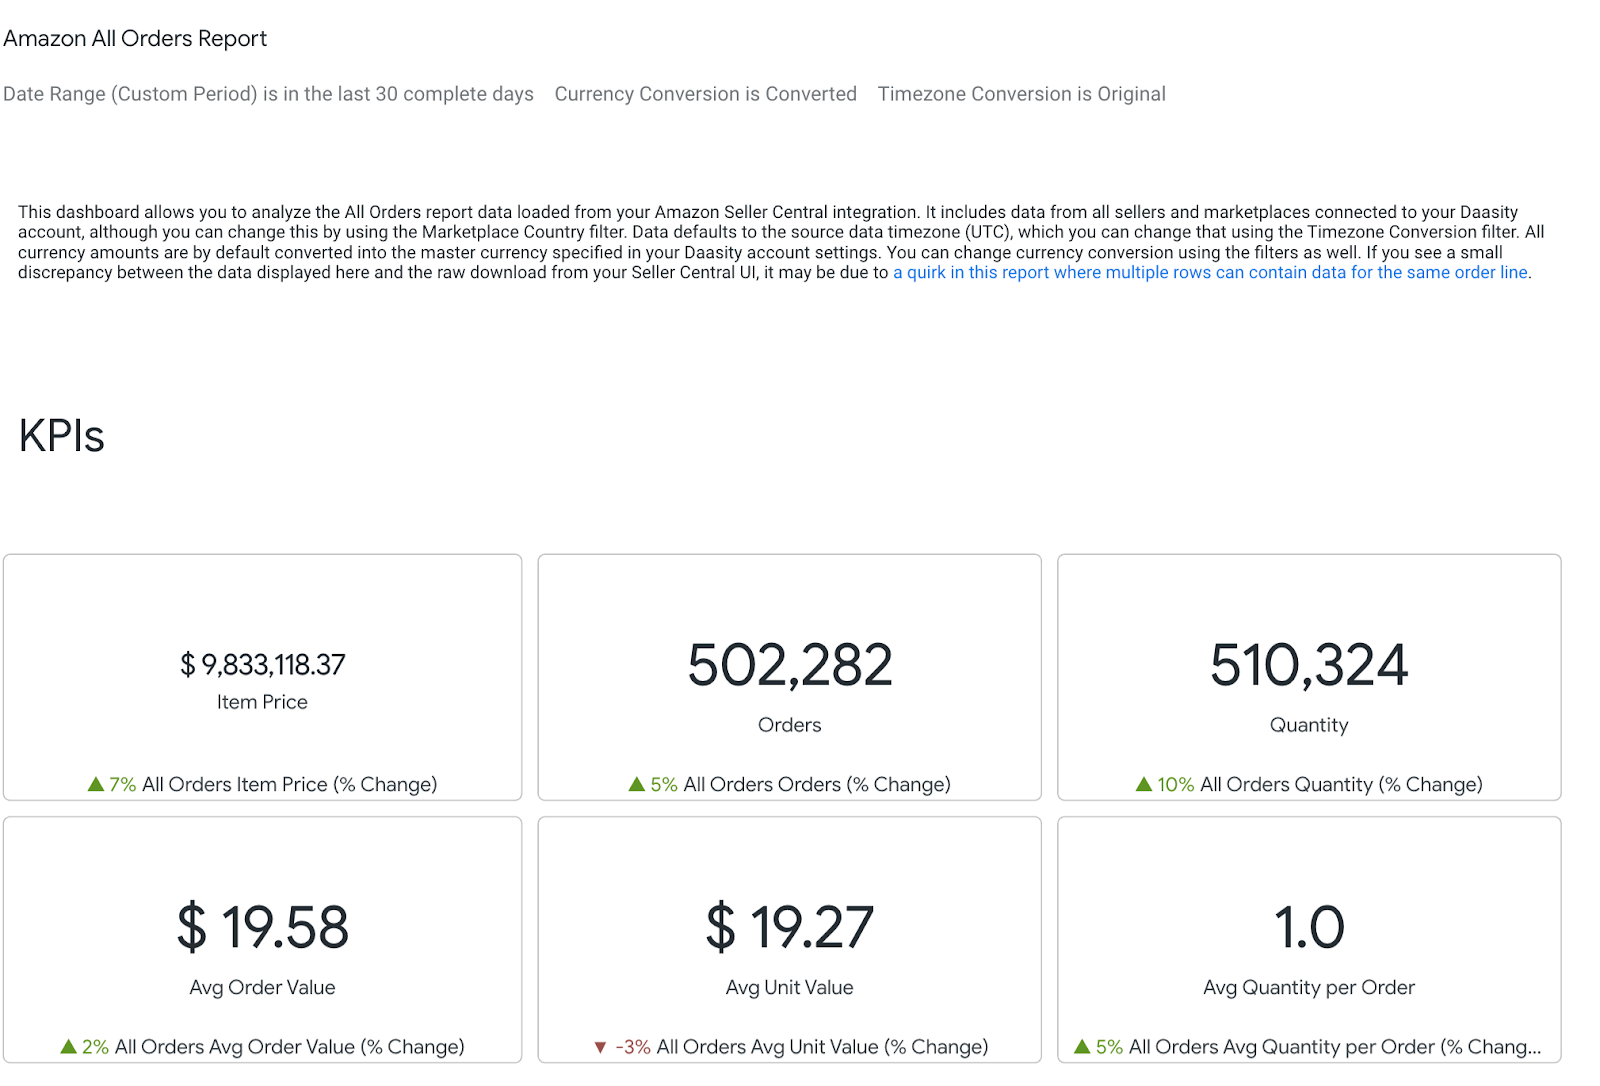
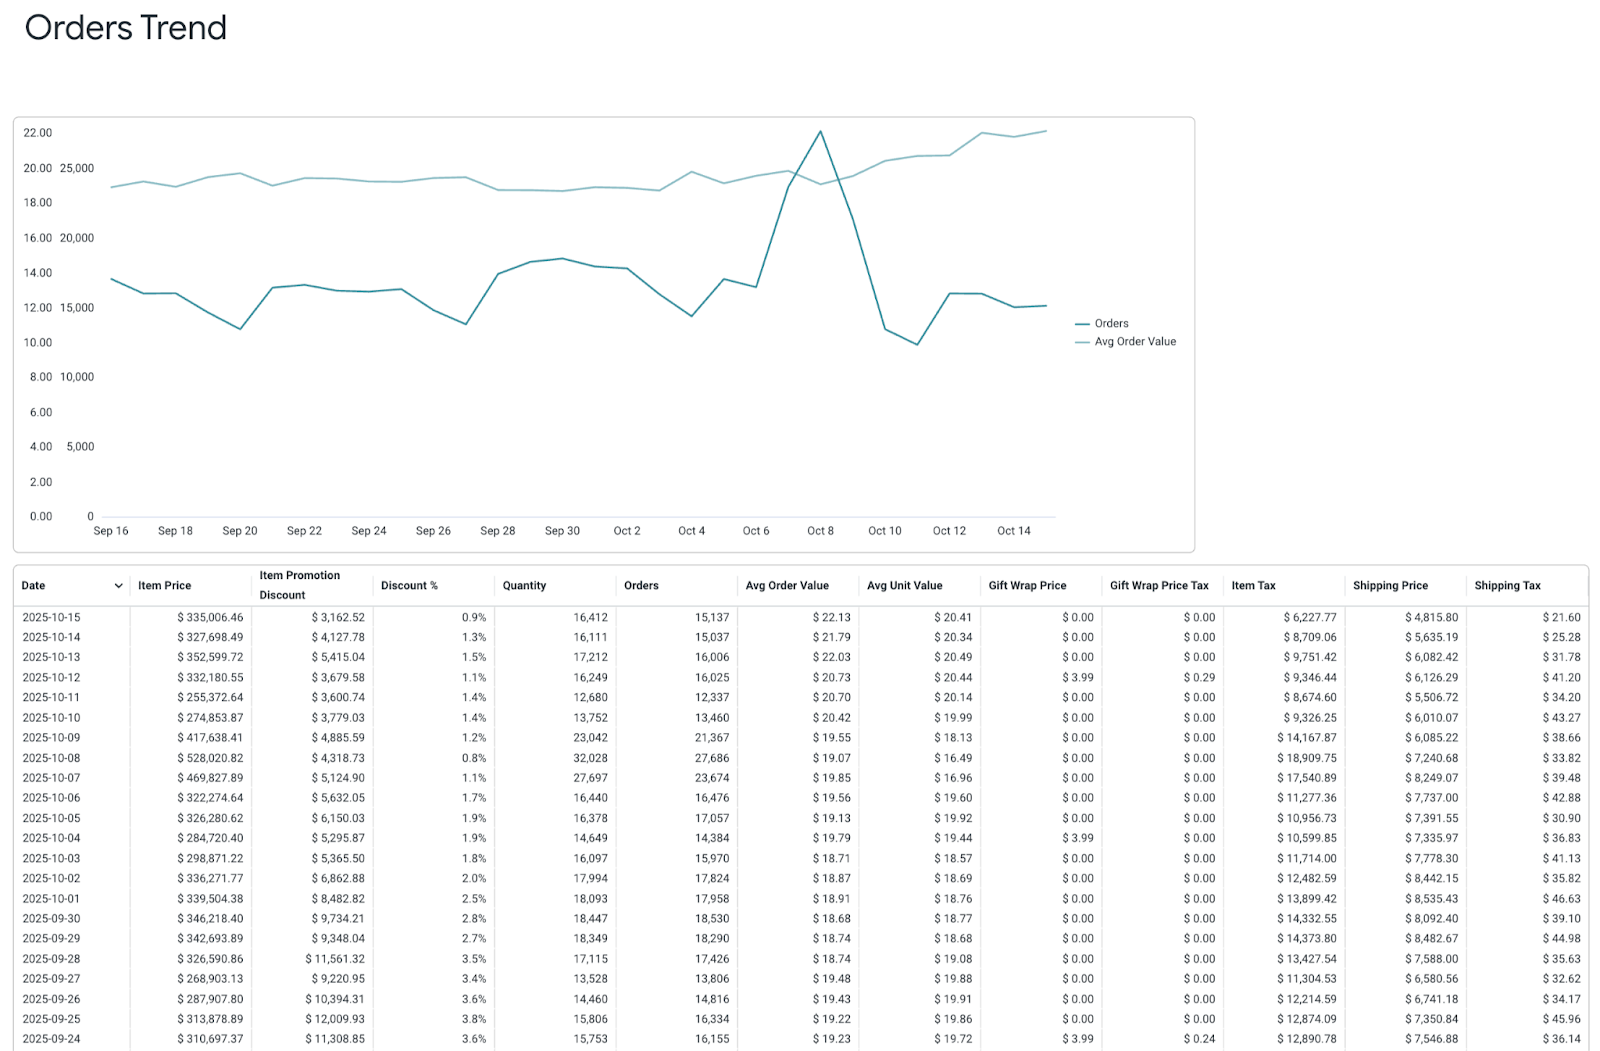
Data Report Ex. #2: All Orders Report:
Navigation: Amazon Seller Central > Sidebar/Top Menu > Reports > Fulfillment > Sales > All Orders
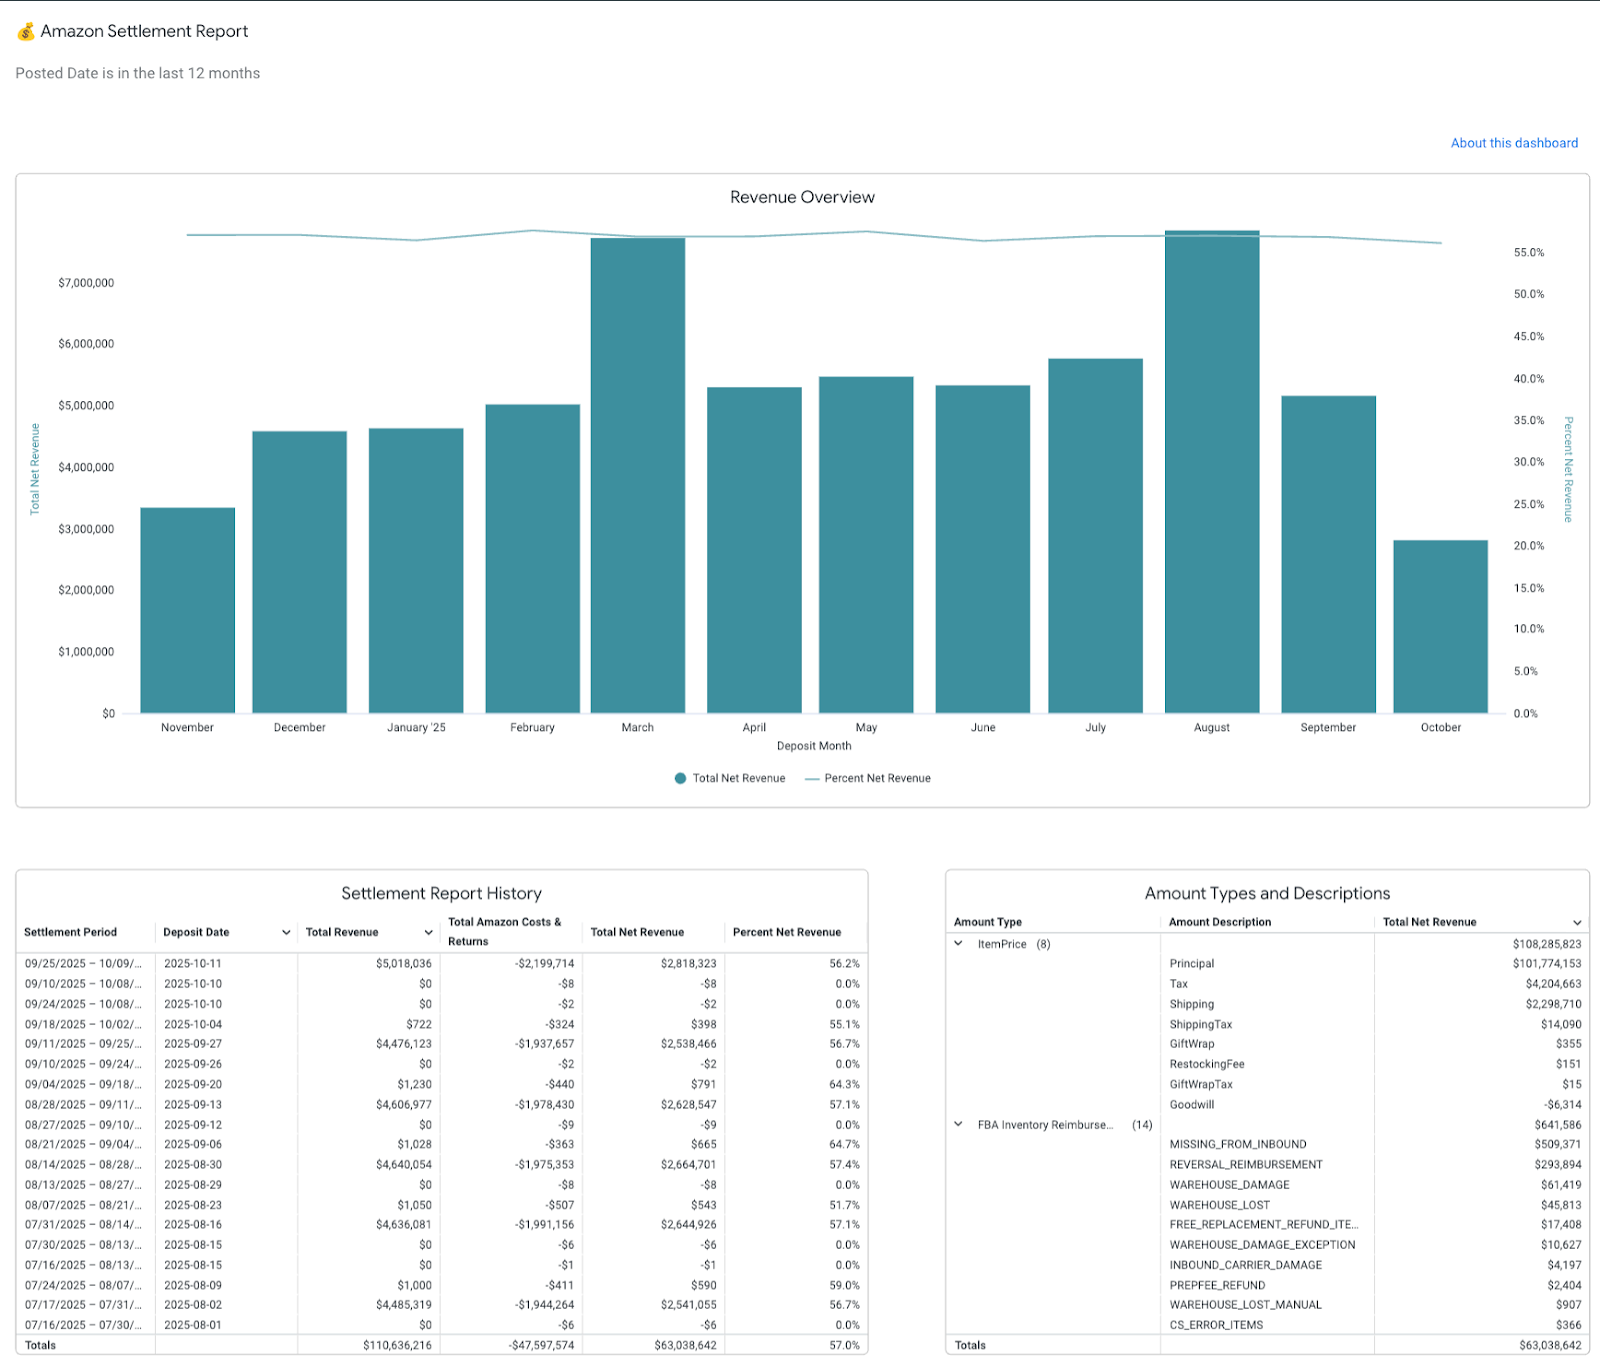
Data Report Ex. #3: Settlement Report
The settlement report is one of Amazon's most challenging data reports. It contains the full breakdown of fees associated with your Amazon Seller Account and, most importantly, what you're going to get paid.
Unlike other reports, you can't schedule or request the settlement report. Amazon decides when you receive it (typically weekly for most brands).
Additionally, the report is broken down by region rather than individual marketplaces, which limits your ability to get the marketplace-level granularity you might need for detailed analysis.
Data Source Three: The Amazon Selling Partner API (SP-API)
Amazon’s current API, the SP-API, is a REST API that replaced its previous API, Marketplace Web Services (MWS) in 2021. Where MWS fell short in terms of incomplete data, the SP-API shines: you can extract an enormous amount of data from the SP-API.
Although there are still significant challenges (we emphasize: significant), the SP-API was a major leap forward for Amazon and has facilitated data extraction.
When you use it: The SP-API allows brands to extract data around their Amazon businesses. A caveat: the data is still fundamentally limited, as Amazon only provides product (including inventory), fulfillment, and orders data. You cannot get any customer data from any Amazon API or report.
You can make API calls daily in order to extract the data you need for reporting and analyses on your Amazon business.
How you use it: In order to get access to the SP-API, a developer on your team will have to submit a developer application through your Seller Central account. They will also need an AWS account and set up AWS IAM (Identity and Access Management).
The end-to-end approval process can be time-consuming and may take weeks or months.
Why you use it: Leveraging the SP-API will be necessary for brands looking to get a complete Amazon data picture, for those with high data volumes, and/or for those looking to automate their data or programmatically their data (instead of downloading reports every day).
A Rate Limit Quirk: Amazon uses a token bucket algorithm for the SP-API, but the token bucket is not the only limit that Amazon has. For instance, the Reports API has restrictions on specific reports in terms of how often they can be generated. Unfortunately, Amazon does not provide documentation on which reports fall into specific periods, so you have to learn by a lot of trial and error.
Amazon Data Quirks To Be Aware Of
Now that you know where to get your data, here are the key quirks you need to be aware of to avoid reporting headaches and mismatched numbers.
Data Quirk 1: Amazon Seller Central Reports Are Not Up-to-Date
Although the high-level data in your Amazon Seller Central Dashboard is up-to-date, all data in the reports that you download from Seller Central run on 48-hour delays.

So, if you download a data report from Amazon Seller Central on Wednesday morning, you’re looking at data that is updated through Sunday. This means that Wednesday is the first day that you can analyze last week’s data.
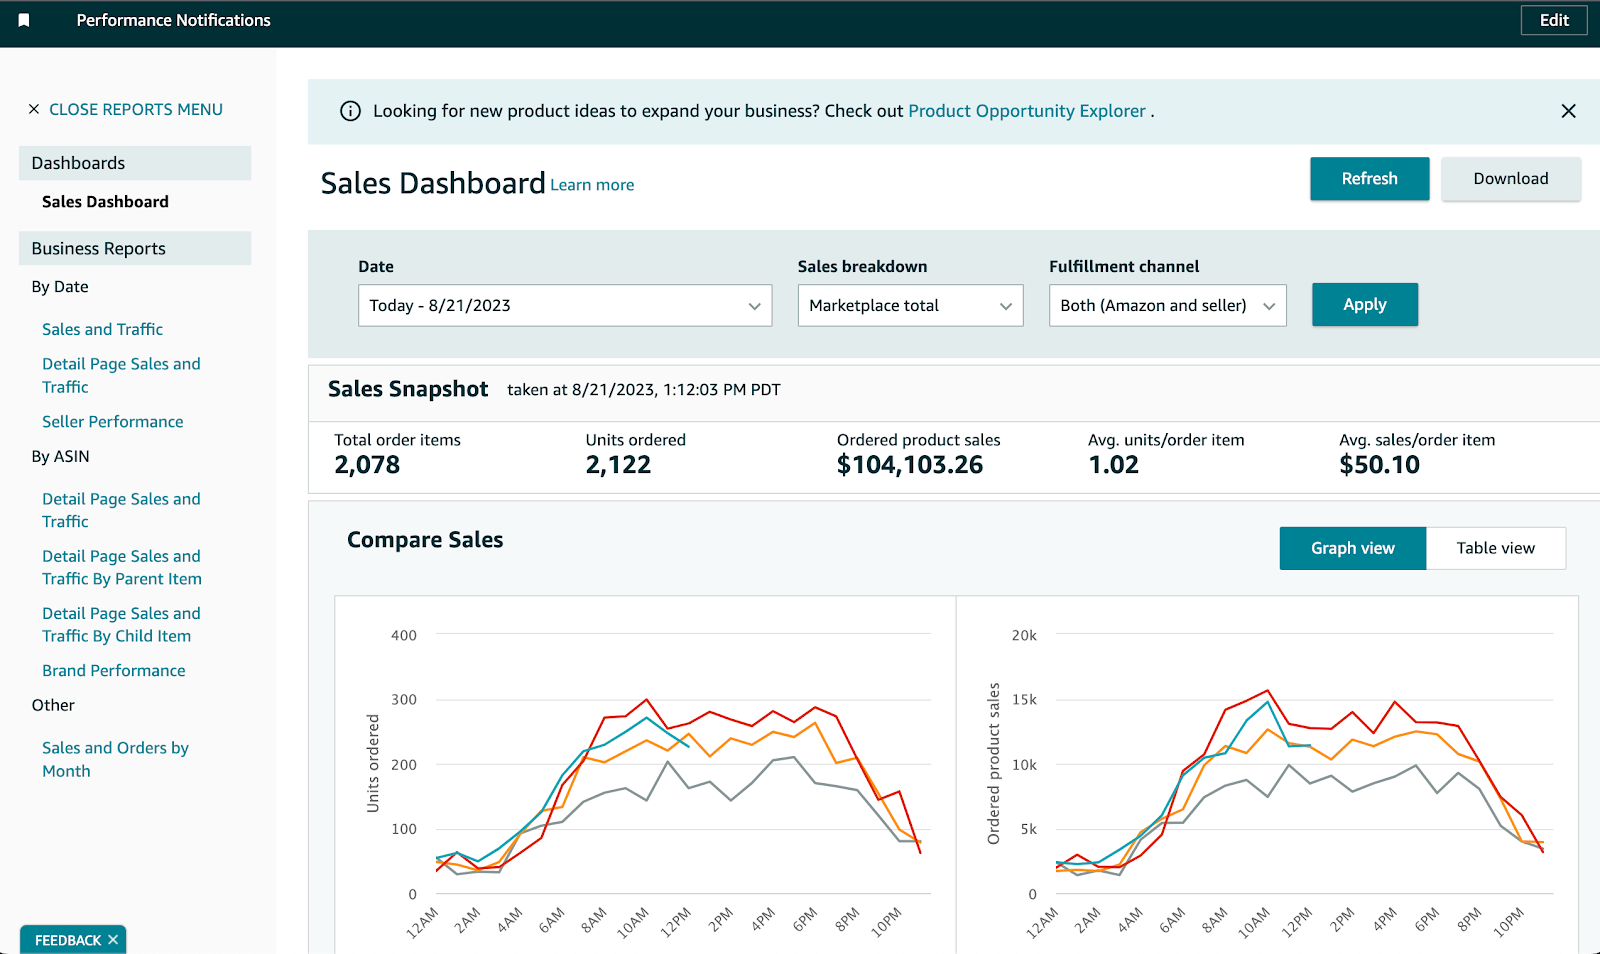
Data Quirk #2: The Business Reports and the All Orders Report don't match
If you're trying to set up reporting and pull summary sales data from the Business Reports dashboard while also using the All Orders Report for customer-level analysis, you're going to notice discrepancies.
Why don't they match? Amazon's Business Reports capture all orders that have been placed, while the All Orders Report only includes orders where payment has been processed and Amazon has received the funds.
The granularity difference: The Business Reports give you sales data rolled up to the day and product level. That's as granular as it gets. The All Orders Report goes all the way down to the individual item within an order, complete with customer and shipping information.
What this means for you: These reports serve different analytical purposes. If you need high-level sales summaries, use the Business Reports. If you need to analyze customer behavior, order composition, or geographic trends, you'll need the All Orders Report. Just don't try to reconcile them perfectly. You'll either need to accept the mismatch or commit to using one as your single source of truth for sales reporting.
Data Quirk #3: Amazon's "Returning Customer" Definition
If you're looking at Amazon's customer insights reports in Seller Central, you should know that Amazon only flags a customer as "returning" if they've purchased from you within the last 12 months.
This is very different from how most brands think about retention. If a customer bought from you 18 months ago and comes back today, Amazon will label them as a "new" customer in their UI. The report will show you what percentage of customers are returning within whatever window you're looking at—a week, a month, or up to a year maximum. But it won't tell you about true lifetime retention.
For accurate lifetime retention analysis, you'll need to track this yourself using the hashed email addresses from the All Orders Report (more on that below), or use a platform like Daasity that calculates retention based on whether a customer has ever purchased before (not just in the past year).
Data Quirk 4: API-Rate Limit Headaches
Like other APIs, Amazon enforces rate limits (i.e., only allowing so much data to be pulled in a given time period) on the SP-API.
Amazon’s strict API limitations makes extracting data for some endpoints quite slow. For example, the Reports API createReport endpoint has a burst of 15 and is throttled to a rate (requests per second) of 0.0167, or about 1 request per minute.
In other words, you can request 15 reports in the first second, then you’ll have to wait another minute before you can create 1 more report, and so on. After an hour, you can do another burst.
This rate limit is okay for smaller merchants, but for larger merchants who sell in multiple countries, the number of reports that you need adds up quickly, especially when you need historical data.
Going Headacheless and Quirkless: Let Daasity Handle Your Amazon Data
Not to put too fine a point on this, but...extracting your Amazon Seller Central data and creating a single source of truth around that data is a nightmare. It takes experienced analysts hours, every day, to correctly download and make sense of all the Amazon data reports (this doesn’t even include running daily and then as-needed queries on the reports).
As it happens, we (Daasity) have a robust Amazon Seller Central integration that allows you to automate and visualize all the Amazon data we’ve discussed in this piece…
...Including historical data, the Settlement Reports, and all your other Amazon reports.
Basically, we’re trying to lower your Advil budget and increase your Amazon revenue.
Daasity’s Amazon dashboards replicate your Seller Central business reports, so you can see your sales performance directly in Daasity, drill down as far as you want, and combine your Amazon data with data from your other sales channels, advertising platforms, and more.
What Brands Are Saying About Daasity's Amazon Integration
"Before we had Daasity, pulling together Amazon reports was quite a painstaking process, having to download the individual reports and create spreadsheets. Daasity was a big time-saver once those numbers were automated."
— Jon Barrett, Amazon Specialist, Creative Solutions
"We use Daasity's Amazon integrations to identify trends and opportunities, then use those insights to inform our assortment strategy to drive higher upfront AOV, and by extension, LTR. Our board members were blown away by our level of data sophistication for Amazon, and we're just getting started."
— Josh Knopman, SVP of Growth & Digital product, Blueland
"After migrating from Glew.io to Daasity, Reshoevn8r reduced their Amazon spend by 11.9% and increased their gross sales by 8.8%. Spending optimization led to an improvement in ROAS from 9.7x to 12x."
— Corrie McDonald, Director of Operations, Reshoevn8r
Ready to Transform Your Amazon Data?
For current Daasity customers: Get a free hour with your strategist to set up your Amazon settlement report! This offer is available through 2025, so don't let it go to waste.
Schedule your Settlement Report setup now.
For brands new to Daasity: Let's talk about your specific challenges and how you can build a source of truth around your Amazon data. Get in touch.
%20(1).png)
